Here are the details of the economic calendar for October 6:
Europe’s retail sales were published yesterday, which showed not just a slowdown in growth, but no change at all since the beginning of the year by 0%. It can be recalled that retail sales grew by 3.1% last month. Such negative statistics almost immediately affected the euro in terms of sales. This was followed by the publication of the ADP report during the US trading session, which recorded an increase in US employment by 568 thousand in September. The indicators came out better than the forecast, but the US dollar was already overbought at that time.
* The volume of retail sales is one of the main economic indicators, which is an indicator of the change in sales volume in the context of retail trade. In simple words, this indicator reflects the purchasing power of the population.
* The employment report from ADP shows the change in the number of workers in the United States. The growth of the indicator has a positive effect on the unemployment rate in the country, as well as on consumer activity, which in turn, has an impact on economic growth.

Analysis of trading charts from October 6:
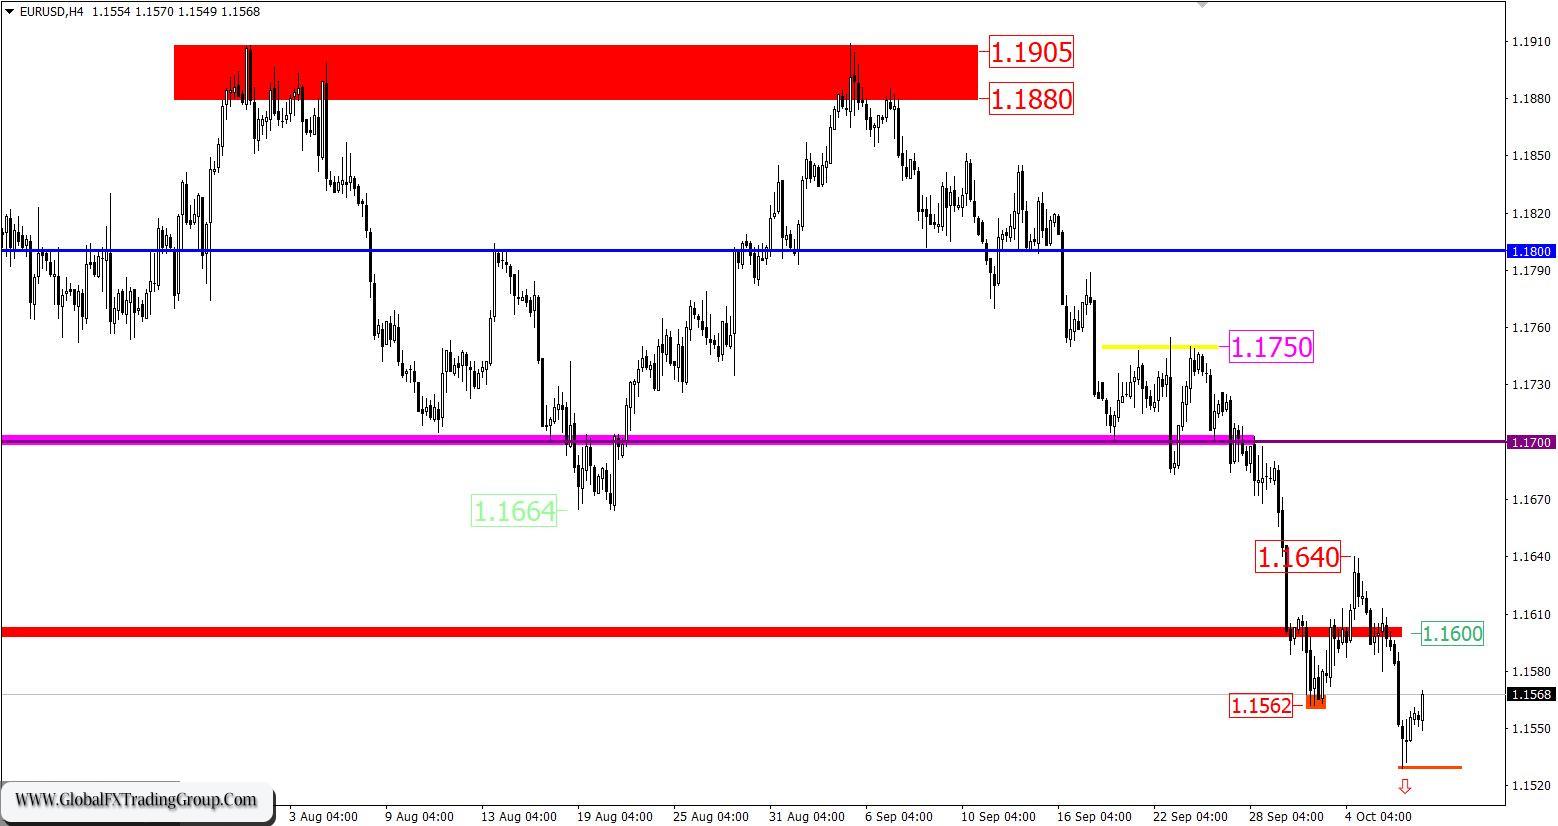
The EUR/USD pair continued its downward cycle after a slight pullback. The resistance level was 1.1640, relative to which there was a gradual increase in the volume of short positions. As a result, the local low (1.1562) of September 30 was broken. The lack of major correction signals a high interest in the position to sell the euro. This indicates that the downward cycle from the beginning of June is considered the main movement that traders are focused on.
The trading plan on October 6 allowed for further weakening of the euro if the price was kept below the local low (1.1562) on September 30.
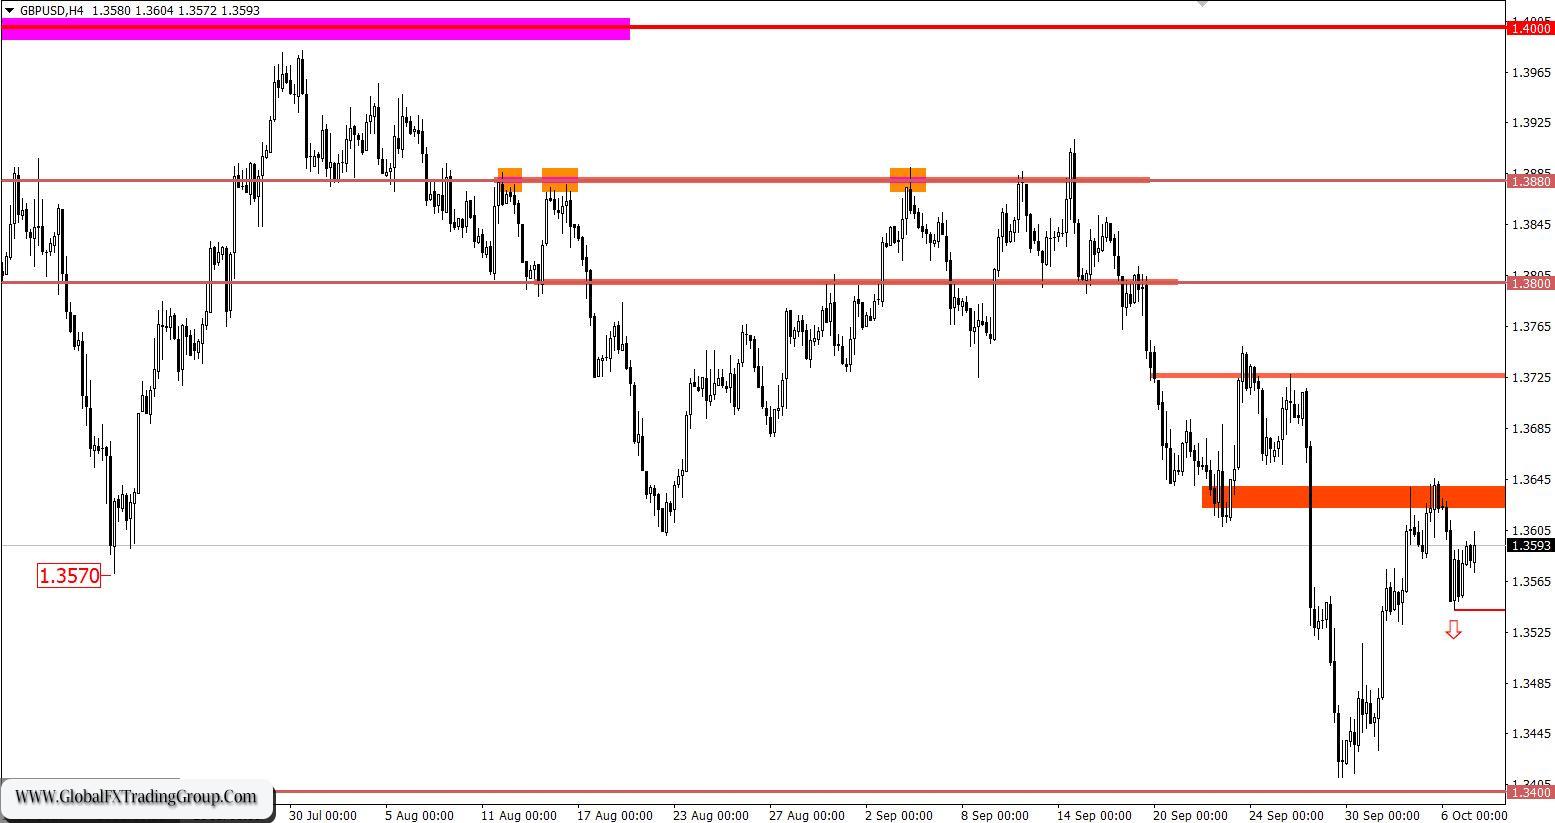
The GBP/USD pair has completed the corrective move within the resistance area of 1.3620/1.3650. This led to the pound’s gradual weakening.
It can be recalled that there has been a correctional move on the market since September 30, as a result of which the pound has strengthened against the US dollar by more than 230 points. The correction did not violate the integrity of the downward trend from the beginning of June, so sellers still have a chance for a deeper decline in the pound.
• Short positions or Short means sell positions.
* The resistance level is the so-called price coordinate, from which the quote can slow down or stop the upward movement. The principle of constructing this level is to reduce the price stop points on the history of the chart, where a price reversal in the market has already taken place.
October 7 economic calendar:
Today, the United States will release its data on applications for unemployment benefits, where their volume is predicted to decline. This could support the US dollar if expectations coincide. Details of statistics: The volume of initial applications for benefits may fall from 362 thousand to 350 thousand. The volume of repeated applications for benefits may fall from 2 802 thousand to 2 780 thousand.
* Applications for unemployment benefits reflect the number of currently unemployed citizens and those receiving unemployment benefits. This indicator is considered to be the state of the labor market, where the growth of the indicator negatively affects the level of consumption and economic growth. The reduction of applications for benefits has a positive effect on the labor market.
Trading plan for EUR/USD on October 7:
Despite the euro’s recent decline, downward interest prevails in the market. The subsequent growth in the volume of short positions is expected if the price is kept below the level of 1.1520. This will lead to a strengthening of the downward movement towards the 1.1420 mark. In case of a technical pullback relative to the current values, the price may move in the direction of the 1.1600 level, where a small stagnation will occur.

Trading plan for GBP/USD on October 7:
It can be assumed that the downward cycle is still relevant in the market, where the recent correction will be won back by traders during the new trading week. The subsequent growth in the volume of short positions is expected if the price is kept below the level of 1.3530. This price movement will open the way towards the support level of 1.3400.

What is reflected in the trading charts?
A candlestick chart view is graphical rectangles of white and black light, with sticks on top and bottom. When analyzing each candle in detail, you will see its characteristics of a relative period: the opening price, closing price, and maximum and minimum prices. Horizontal levels are price coordinates, relative to which a stop or a price reversal may occur. These levels are called support and resistance in the market.
Circles and rectangles are highlighted examples where the price of the story unfolded. This color selection indicates horizontal lines that may put pressure on the quote in the future. The up/down arrows are the reference points of the possible price direction in the future.
*The market analysis posted here is meant to increase your awareness, but not to give instructions to make a trade.
If you have an interest in any area of Forex Trading, this is where you want to be.
Global Fx Trading Group is a world leader in providing Fx services to individual traders, including: Unmatched funding programs, on-line education, virtual trading rooms, automation tools, robot building, and personal coaching.
The company was first established by Jeff Wecker, former member of the Chicago Board of Trade, with 25 years in the industry. Jeff has a keen understanding of the needs of Forex traders and those needs are our focus.
Please join our VIP Group while is still FREE …
https://t.me/joinchat/JqsXFBKpyj3YS4bLWzT_rg
Our mission is simple: To enhance as many lives as we can through education and empowerment.
#theforexarmy #forexsigns #forexsignals #forexfamily #forexgroup #forexhelp #forexcourse #forextrade #forexdaily #forexmoney #forexentourage #forextrading #forex #forexhelptrading #forexscalping #babypips #forexfactory #forexlife #forextrader #financialfreedom
