EUR/USD

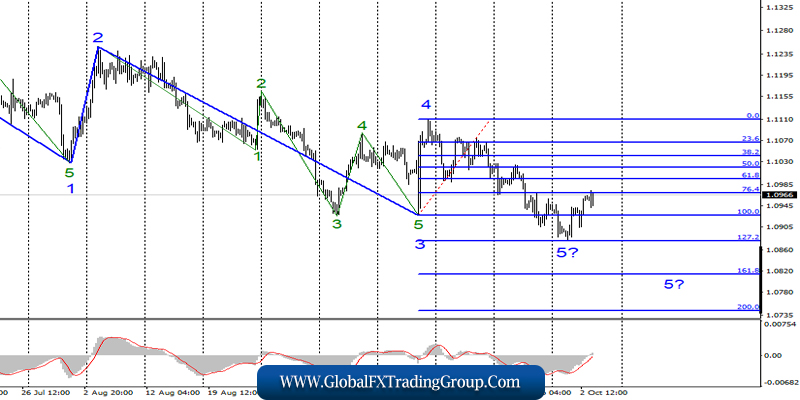
On Wednesday, October 2, the EUR/USD pair ended with an increase of 30 basis points. At the current time, the instrument has increased to the Fibonacci level of 76.4%.
Thus, there are grounds to assume the completion of the construction of wave 5 of the downward trend section. If this is true, then from the current position, the euro/dollar pair will not only continue to increase but will also move to build a full-fledged upward trend section.
However, at the same time, it should be noted that the news background at any moment can return sellers to the foreign exchange market, and wave 5 – can become more complicated at any time.
Fundamental component:
What the euro should not count for sure, as it is against the news background. By some miracle, the increase in quotations of the instrument continues although the indices of business activity in the services sector of Germany, the European Union, and some EU countries were released in the first half of the day.
The most interesting indices – Germany and the EU – were weaker than market expectations. The market worked out these weak reports, but then resumed the rise of the euro, which is difficult to explain. On the other hand, recoilless movements still do not happen.
The current increase in the euro can be explained by the construction of an upward corrective wave. Thus, shortly, the decline in the pair’s quotes may resume within the same wave 5.
Today, we are still waiting for business activity indices in the US services sector, if they are better than the expectations of the forex market, it will be extremely difficult for bulls to hold their positions.
Purchase targets:
1.1109 – 0.0% Fibonacci
Sales targets:
1.0876 – 127.2% Fibonacci
1.0814 – 161.8% Fibonacci
General conclusions and recommendations:
The euro/dollar pair continues to build a downward set of waves. Today, I expect the resumption of the decline of the pair with targets located near the estimated marks of 1.0876 and 1.0814, which is equal to 127.2% and 161.8% of Fibonacci, within the wave 5, 5. I recommend selling the instrument on the MACD signal “down”. An unsuccessful attempt to break the level of 76.4% can also lead to the resumption of the construction of a downward set of waves.
GBP/USD

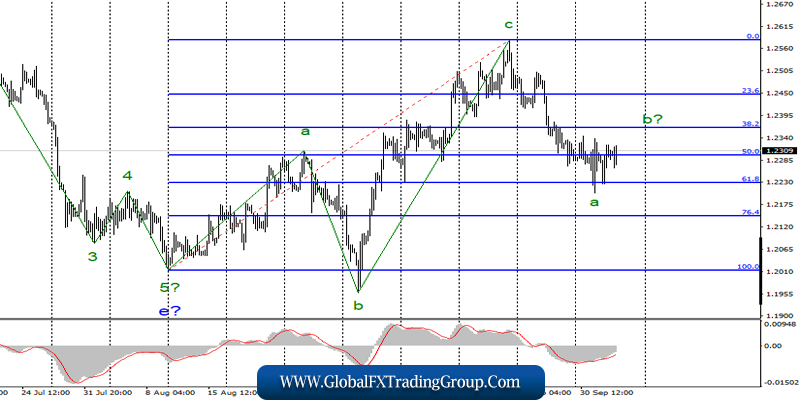
On October 2, the GBP/USD pair lost several base points and made another unsuccessful attempt to break through the Fibonacci level of 61.8% during the day. Thus, the instrument seems to have moved on to construct a second wave as part of a downward wave structure.
If this assumption is correct, the price increase will continue with the targets located near the Fibonacci level of 38.2%. An unsuccessful attempt to break through this level can lead to the transition to the construction of wave 3 or C with the targets under the 22nd figure.
Fundamental component:
The British PMI for the manufacturing sector showed a positive trend the day before yesterday, increasing from 47.7 to 48.3, but the index of business activity in the service sector today fell to 49.5.
Against this background, it would be more logical to see the decline of the instrument, however, the need to build a correctional wave pushes the pair upwards like the euro/dollar pair.
Sellers of the pair today can only rely on US economic reports on the same business activity in the service sector. Also, the pound can have a beneficial effect on the information about the new proposal of Boris Johnson to the European Union on the deal on Brexit.
Although the European Union has so far accepted this proposal with some skepticism, it is still a step of the British government towards Brexit with the agreement.
However, any information that shows that the parties are still far from signing the deal will again trigger sales of the pound.
Sales targets:
1.2229 – 61.8% Fibonacci
1.2147 – 76.4% Fibonacci
Purchase targets:
1.2582 – 0.0% Fibonacci
General conclusions and recommendations:
The pound/dollar currency pair supposedly continues to build a bearish trend section. Thus, now I expect the construction of a corrective wave, which can be completed near the Fibonacci level of 38.2%, and the resumption of the decline of the instrument in the direction of the Fibonacci levels of 61.8% and 76.4% in the construction of wave 3 or C.
The MACD signal “down” may indicate the construction of a new bearish wave.
*The market analysis posted here is meant to increase your awareness, but not to give instructions to make a trade.
If you have an interest in any area of Forex Trading, this is where you want to be.
Global Fx Trading Group is a world leader in providing Fx services to individual traders, including: Unmatched funding programs, on-line education, virtual trading rooms, automation tools, robot building, and personal coaching.
The company was first established by Jeff Wecker, former member of the Chicago Board of Trade, with 25 years in the industry. Jeff has a keen understanding of the needs of Forex traders and those needs are our focus.
Please join our VIP Group while is still
FREE …
https://t.me/joinchat/JqsXFBKpyj3YS4bLWzT_rg
Our mission is simple: To enhance as many lives as we can through education and empowerment.
#theforexarmy #forexsigns #forexsignals #forexfamily #forexgroup #forexhelp #forexcourse #forextrade #forexdaily #forexmoney #forexentourage #forextrading #forex #forexhelptrading #forexscalping #babypips #forexfactory #forexlife #forextrader #financialfreedom
