EUR/USD

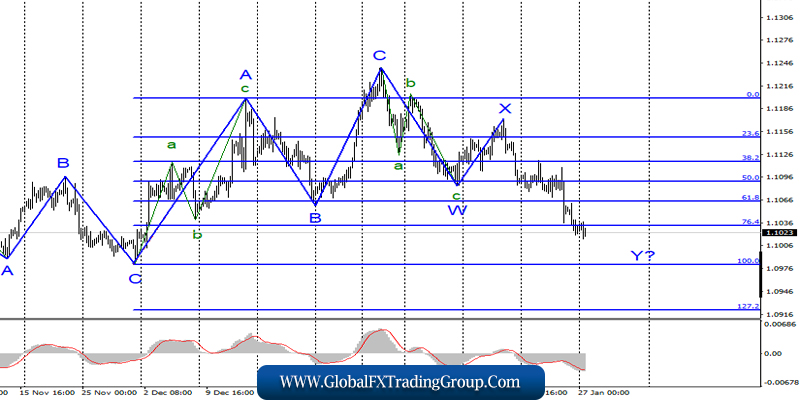
On January 24, the EUR/USD pair lost about 30 basis points and thus continues to build the expected wave y. If this is true, then a successful attempt to break the 76.4% Fibonacci mark indicates that the markets are ready for further sales of the euro currency. The wave y becomes more extended than originally calculated. Around the 100.0% Fibonacci level, its construction may be completed.
Fundamental component:
The news background for the tool on Friday was interesting, and most importantly – expected. By this time, the markets had already moved away from the shock caused by Christine Lagarde’s speech a day earlier, and now they were hoping for more or less positive information from the eurozone.
Business activity in all sectors of Germany increased compared to the previous month, and also significantly exceeded market expectations. The most important thing is that the index of business activity in the manufacturing sector has started to recover, which causes the greatest concerns for Christine Lagarde.
In the eurozone as a whole, business activity did not disappoint. In the services sector, there was a slight decrease to 52.2, which is not critical for the indicator, and in the production sector – an increase to 47.8, which is 1.5 points higher than a month earlier.
The composite business activity index was 50.9, the same as a month earlier. After these economic reports, it was quite possible to expect a small increase in the euro currency, however, the demand for it did not grow, and the markets continued to wait for US reports.
In America, only one index was upset – business activity in the manufacturing sector, which fell in January to 51.7. It is also not critical yet, however, the trend itself is frightening. Since May 2018, this index has slipped from a value of 56.6 to 49.9 in August 2019. There has been a slight increase in recent months, but now it seems that the index has started to decline again.
The other two indexes exceeded the expectations of the Forex market, and they are “all right”. In general, we can say that such statistics packages cannot be interpreted unambiguously. We can also note business activity in the EU and German manufacturing sectors, which remains very weak. And you can focus on the declining business activity in the US manufacturing sector.
General conclusions and recommendations:
The euro-dollar pair is presumably continuing to build a downward set of waves. Thus, I would recommend continuing to sell the instrument with targets located around the mark of 1.0982, which corresponds to 100.0% of Fibonacci. An unsuccessful attempt to break this mark will lead to quotes moving away from the reached lows and, possibly, completing the construction of the wave y.
GBP/USD

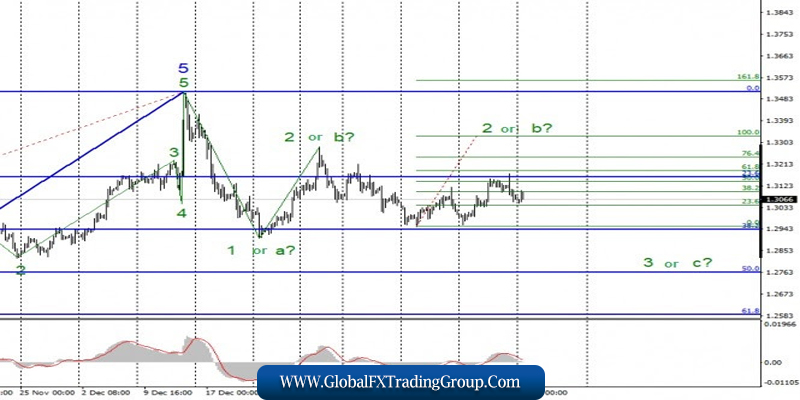
The GBP/USD pair lost about 50 basis points on January 24 and continues to remain within the framework of building either wave 2 or b or wave 3 or C. The section of the trend that began after December 23 is very complex and confusing in its internal structure.
If the instrument is currently in the stage of building a wave 2 or b, the instrument may rise to the area of the 100.0% Fibonacci level. If the instrument is currently at the stage of building wave 3 or C, then an unsuccessful attempt to break the 23.6% Fibonacci level (blue grid) already shows readiness for a new decline. In general, the situation is ambiguous.
Fundamental component:
The news background for the GBP/USD instrument on Friday was also interesting, and as it turned out later – quite optimistic. After 7 months spent under the mark of 50.0, business activity in the manufacturing sector finally came close to getting out of the area that signals a downward turn in the industry.
The index value in January is 49.8. The same can be said about the index of business activity in the service sector, which only in December managed to get out of the zone “under the mark of 50.0”, and in January – it significantly increased to 52.9. However, all this news did not help either the euro currency or the British currency.
Markets continued to sell these currencies, probably taking into account first of all the ECB meeting that has already taken place, and the Bank of England meeting that will only take place this week. During the first meeting, the markets concluded that the bank’s mood will remain “dovish” for a very long time, and the expectations from the Bank of England’s meeting are to lower the key rate.
General conclusions and recommendations:
The pound-dollar tool continues to build a new downward trend. I recommend selling the instrument again with targets located around 1.2941 and 1.2764, which corresponds to 38.2% and 50.0% for Fibonacci, using the new MACD “down” signal, which was formed around the level of 23.6% for Fibonacci.
The tool can complicate wave 2 or b, so the increase can continue to 1.3329 (in the case of a successful attempt to break the 23.6% Fibonacci level), and sales are then recommended to be considered around the mark of 1.3329.
*The market analysis posted here is meant to increase your awareness, but not to give instructions to make a trade.
If you have an interest in any area of Forex Trading, this is where you want to be.
Global Fx Trading Group is a world leader in providing Fx services to individual traders, including: Unmatched funding programs, on-line education, virtual trading rooms, automation tools, robot building, and personal coaching.
The company was first established by Jeff Wecker, former member of the Chicago Board of Trade, with 25 years in the industry. Jeff has a keen understanding of the needs of Forex traders and those needs are our focus.
Please join our VIP Group while is still
FREE …
https://t.me/joinchat/JqsXFBKpyj3YS4bLWzT_rg
Our mission is simple: To enhance as many lives as we can through education and empowerment.
#theforexarmy #forexsigns #forexsignals #forexfamily #forexgroup #forexhelp #forexcourse #forextrade #forexdaily #forexmoney #forexentourage #forextrading #forex #forexhelptrading #forexscalping #babypips #forexfactory #forexlife #forextrader #financialfreedom
