Analysis of transactions in the EUR / USD pair
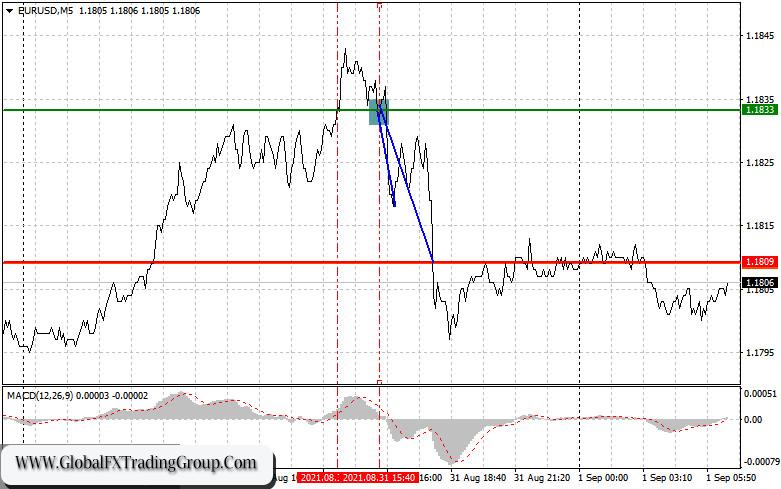
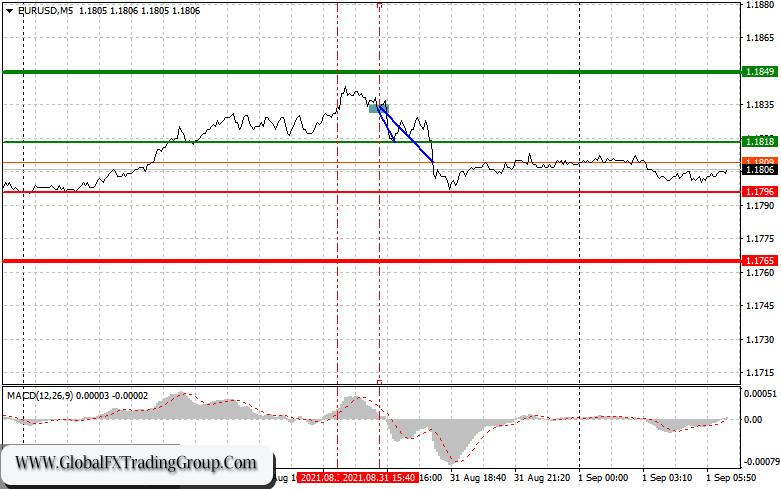
There was a signal to buy in EUR / USD on Tuesday, but it had to be ignored because the MACD line was far away from zero. After some time though the indicator hit the overbought area, so bearish traders were able to open short positions. This provoked a 30-pip decline in the market. There were no other signals for the rest of the day. Surprisingly, even though the data released yesterday exceeded expectations, EUR / USD did not undergo large movements. Only the report on US consumer confidence led to a slight surge in volatility.
Another report will come from Germany and the Euro area today, but it is unlikely to shake the market. Then, in the afternoon, there will be data on US manufacturing and employment, followed by speeches from Fed representatives.
For long positions:
Open a long position when euro reaches 1.1818 (green line on the chart), and then take profit at the level of 1.1849 (thicker green line on the chart). EUR / USD trade upwards if economic data from Germany and the Euro area exceed expectations. But before buying, make sure that the MACD line is above zero, or is starting to rise from it. It is also possible to buy at 1.1796 and 1.1765, but the MACD line should be in the oversold area, as only by that will the market reverse to 1.1818 and 1.1849.
For short positions:
Open a short position when euro reaches 1.1796 (red line on the chart), and then take profit at the level of 1.1765. A decline will occur if the Euro area reports weak manufacturing activity and employment. But before selling, make sure that the MACD line is below zero, or is starting to move down from it. It is also possible to sell at 1.1818 and 1.1849, but the MACD line should be in the overbought area, as only by that will the market reverse to 1.1796.
What’s on the chart:
The thin green line is the key level at which you can place long positions in the EUR / USD pair.
The thick green line is the target price, since the quote is unlikely to move above this level.
The thin red line is the level at which you can place short positions in the EUR / USD pair.
The thick red line is the target price, since the quote is unlikely to move below this level.
MACD line – when entering the market, it is important to be guided by the overbought and oversold zones.
Important: Novice traders need to be very careful when making decisions about entering the market. Before the release of important reports, it is best to stay out of the market to avoid being caught in sharp fluctuations in the rate. If you decide to trade during the release of news, then always place stop orders to minimize losses. Without placing stop orders, you can very quickly lose your entire deposit, especially if you do not use money management and trade large volumes.
And remember that for successful trading, you need to have a clear trading plan. Spontaneous trading decisions based on the current market situation is an inherently losing strategy for an intraday trader.
Analysis of transactions in the GBP / USD pair
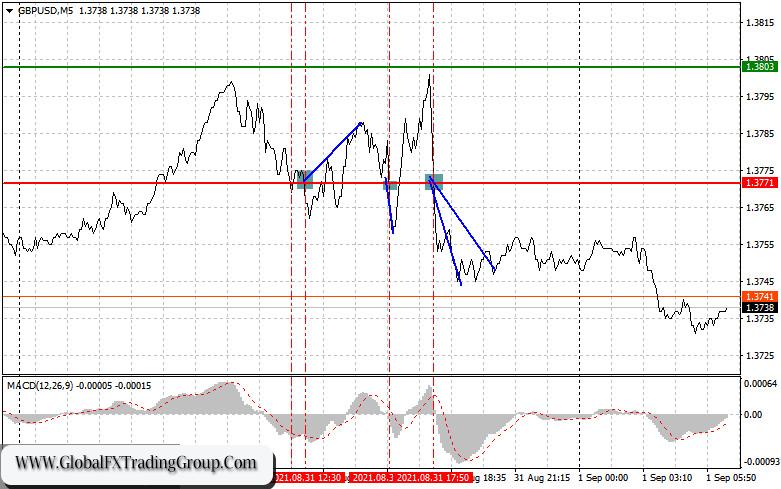
There were several market signals in GBP / USD yesterday. But the first one, which was to sell, had to be ignored because the MACD line was at the oversold area. Following that was a signal to buy, which successfully provoked a 20-pip increase. Then, another signal to sell appeared in the afternoon and this time, it finally coincided with the MACD line moving down from zero. As a result, bearish traders were able to open short positions, which led to a 30-pip decline in the market.
Surprisingly, UK data on lending and money supply did not affect the market in any way, and only the report on US consumer confidence led to a surge in volatility. Today, an interesting report on UK manufacturing activity is coming out, which may put even more pressure on pound. Then, in the afternoon, there will be data on US manufacturing and employment, followed by speeches from Fed representatives.
For long positions:
Open a long position when pound reaches 1.3761 (green line on the chart), and then take profit at the level of 1.3810 (thicker green line on the chart). The pair will continue moving up if there are strong PMI reports. But before buying, make sure that the MACD line is above zero, or is starting to rise from it. It is also possible to buy at 1.3727 and 1.3679, but the MACD line should be in the oversold area, as only by that will the market reverse to 1.3761 and 1.3810.
For short positions:
Open a short position when pound reaches 1.3727 (red line on the chart), and then take profit at the level of 1.3679. A decline will occur if UK releases very weak data on manufacturing activity. But before selling, make sure that the MACD line is below zero, or is starting to move down from it. The pair could also be sold at 1.3761 and 1.3810, but the MACD line should be in the overbought area, as only by that will the market reverse to 1.3727 and 1.3679.
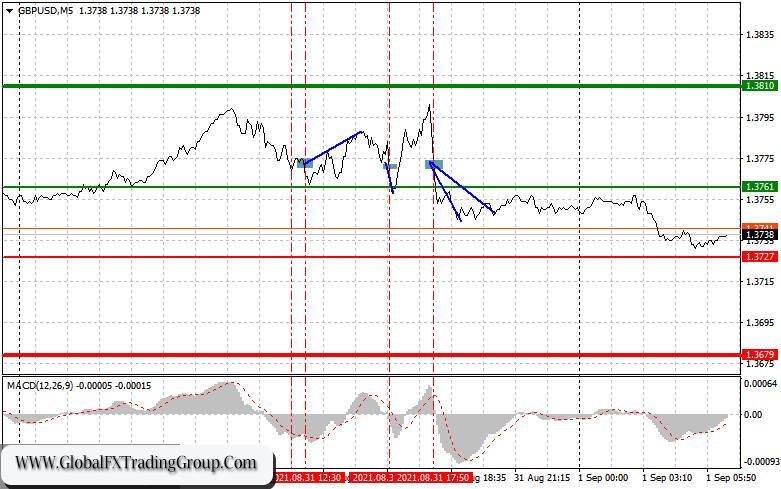
What’s on the chart:
The thin green line is the key level at which you can place long positions in the GBP/USD pair.
The thick green line is the target price, since the quote is unlikely to move above this level.
The thin red line is the level at which you can place short positions in the GBP/USD pair.
The thick red line is the target price, since the quote is unlikely to move below this level.
MACD line – when entering the market, it is important to be guided by the overbought and oversold zones.
Important: Novice traders need to be very careful when making decisions about entering the market. Before the release of important reports, it is best to stay out of the market to avoid being caught in sharp fluctuations in the rate. If you decide to trade during the release of news, then always place stop orders to minimize losses. Without placing stop orders, you can very quickly lose your entire deposit, especially if you do not use money management and trade large volumes.
And remember that for successful trading, you need to have a clear trading plan. Spontaneous trading decisions based on the current market situation is an inherently losing strategy for an intraday trader.
*The market analysis posted here is meant to increase your awareness, but not to give instructions to make a trade.
If you have an interest in any area of Forex Trading, this is where you want to be.
Global Fx Trading Group is a world leader in providing Fx services to individual traders, including: Unmatched funding programs, on-line education, virtual trading rooms, automation tools, robot building, and personal coaching.
The company was first established by Jeff Wecker, former member of the Chicago Board of Trade, with 25 years in the industry. Jeff has a keen understanding of the needs of Forex traders and those needs are our focus.
Please join our VIP Group while is still FREE …
https://t.me/joinchat/JqsXFBKpyj3YS4bLWzT_rg
Our mission is simple: To enhance as many lives as we can through education and empowerment.
#theforexarmy #forexsigns #forexsignals #forexfamily #forexgroup #forexhelp #forexcourse #forextrade #forexdaily #forexmoney #forexentourage #forextrading #forex #forexhelptrading #forexscalping #babypips #forexfactory #forexlife #forextrader #financialfreedom
