Here are the details of the economic calendar for Sept 10:
Last Friday, the UK published its industrial production data, which turned out to be better than forecasted. There was a slowdown in growth rates from 8.3% to 3.8% with the forecast of a decline to 3.2%. The divergence of expectations played in favor of the British currency, but only during the publication of statistical data.
As for the United States, data on producer prices were published, where they recorded growth from 7.8% to 8.3%. Consequently, there is a risk of further growth in inflation, which is already at a record high. The reaction of the US dollar during the period of publication of the data was positive. The US currency started strengthening almost immediately.
Analysis of trading charts from September 10:
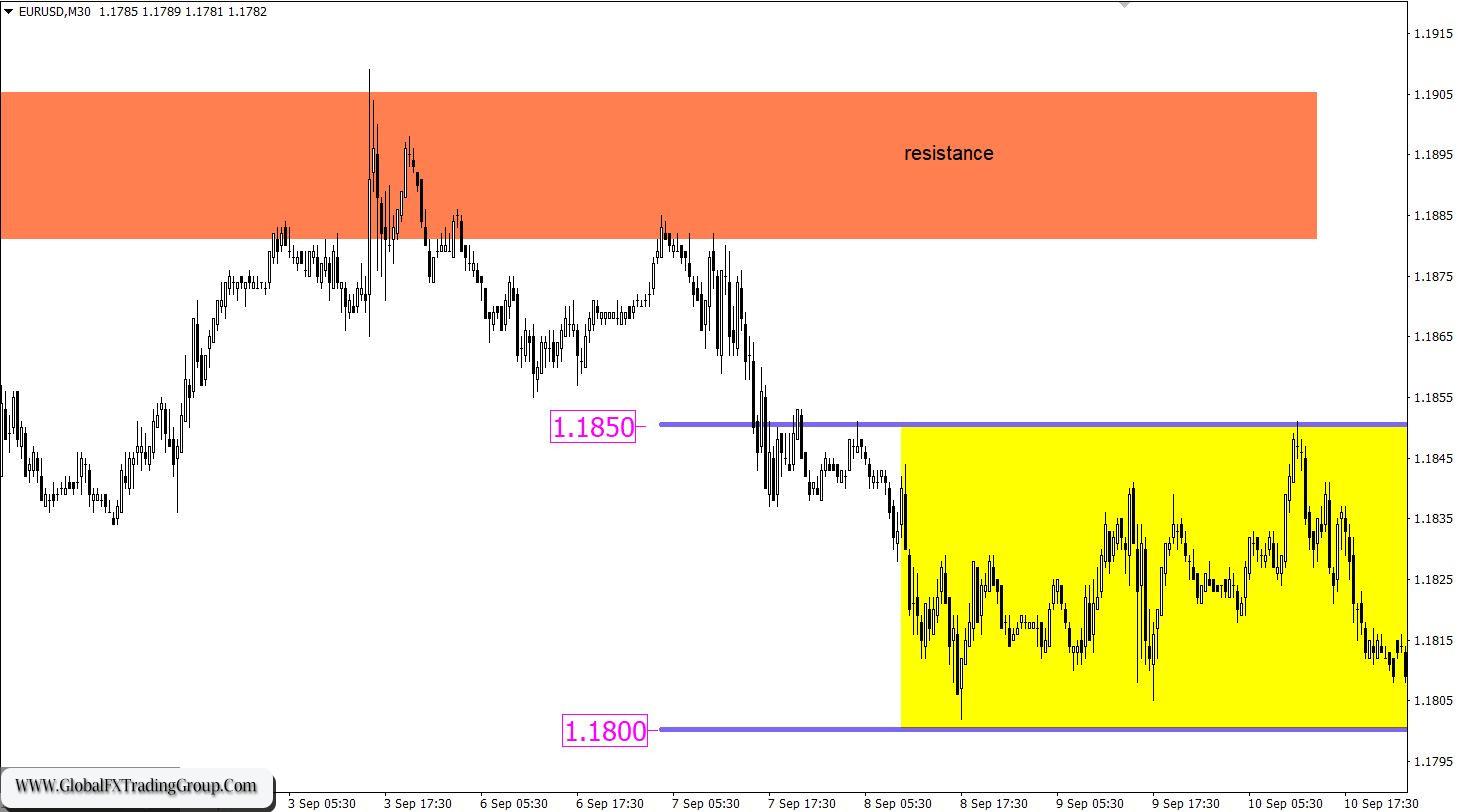
The 50-hour movement in the range of 1.1800/1.1850 was not interrupted last Friday. The quote retained the specified amplitude, consistently working out the borders. This was a signal that there is an accumulation process of trading forces in the market, where downward interest is still relevant.
The trading plan on September 10 considered the scenario of a sideways price movement. The chosen trading strategy was the method of breaking one or another border of the established range 1.1800/1.1850. But since the quote did not manage to stay outside the established borders, no trade deals were opened.

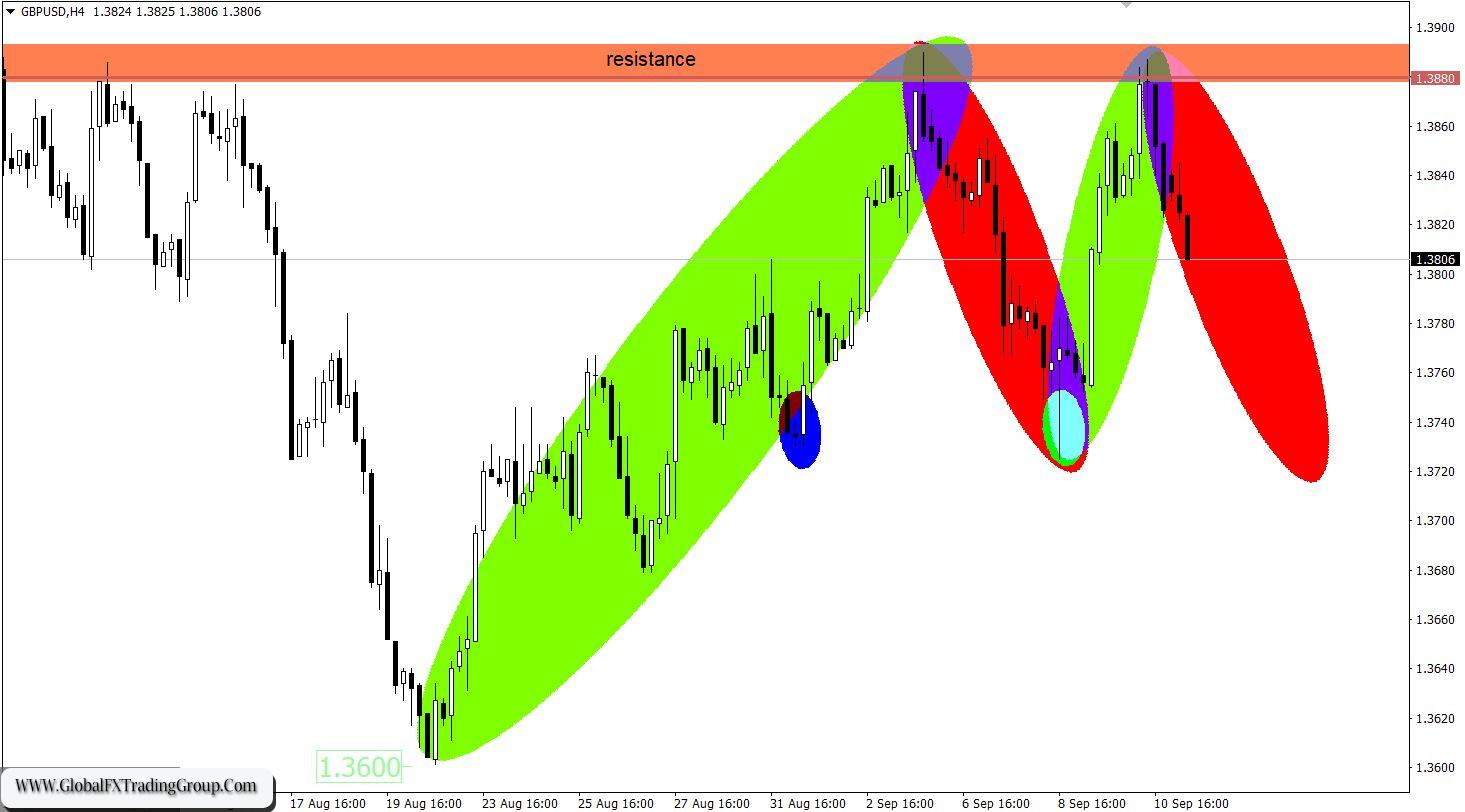
The pound approached the resistance level of 1.3880 during the upward movement from the pivot point 1.3750. This led to a reduction in the volume of long positions and a price rebound along a downward trajectory. It can be noted that the rebound from the level of 1.3880 follows the pattern on September 3. In this regard, traders were ready in advance to open sell positions once the price approached the resistance level.
The trading plan on September 10 considered the possibility of a price rebound from the level of 1.3880. The process of accumulation of trading forces is price fluctuations in a closed amplitude, where a local acceleration in the direction of the breakdown of a particular stagnation border often occurs.
* The resistance level is the so-called price level, from which the quote can slow down or stop the upward movement. The principle of constructing this level is to reduce the price stop points on the history of the chart, where the price reversal in the market has already occurred earlier.
Long positions or Long means buy positions.

September 13 economic calendar:
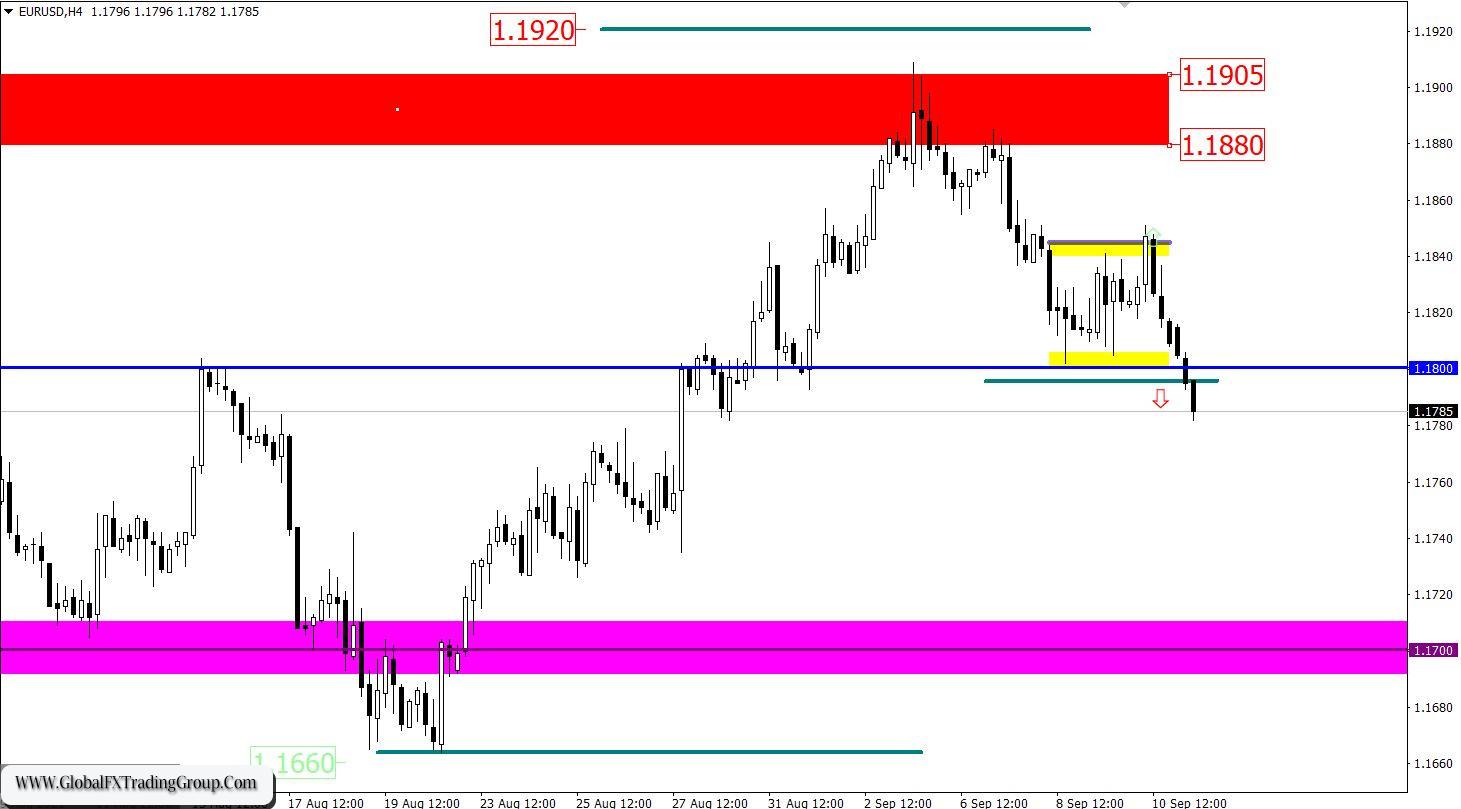
Today, there are no significant statistics for Europe, Britain, and the United States, so the market will be focused on information flow and on technical analysis. In most cases, Monday will not contain important statistics in the economic calendar, but this does not mean that the market will stand in one place on this day. Trading plan for EUR/USD on September 13: The lower border of the side channel 1.1800/1.1850 was broken by market participants during the Asian session.
This led to an increase in the volume of short positions and increased the chance of a subsequent decline of the euro. The price being kept below the level of 1.1790 may lead to a movement towards the 1.1750-1.1700 range.

Trading plan for GBP/USD on September 13:
The downward cycle from the resistance level of 1.3880 returned the quote to the area of 1.3800, while maintaining an active bearish interest in the market. The price being kept below the level of 1.3800 will increase the sellers’ chances of a subsequent move towards the main support point of 1.3750.
Short positions or Short means sell positions.
Bears are the name of market participants that are generally accepted in the exchange environment, who play for lowering currency exchange rates.

What is reflected in the trading charts?
A candlestick chart view is graphical rectangles of white and black light, with sticks on top and bottom. When analyzing each candle in detail, you will see its characteristics of a relative period: the opening price, closing price, and maximum and minimum prices. Horizontal levels are price coordinates, relative to which a stop or a price reversal may occur. These levels are called support and resistance in the market. Circles and rectangles are highlighted examples where the price of the story unfolded. This color selection indicates horizontal lines that may put pressure on the quote in the future. The up/down arrows are the reference points of the possible price direction in the future.
Golden Rule:
It is necessary to figure out what you are dealing with before starting to trade with real money. Learning to trade is so important for a novice trader because the market is constantly dynamic and it is important to understand what is happening.
*The market analysis posted here is meant to increase your awareness, but not to give instructions to make a trade.
If you have an interest in any area of Forex Trading, this is where you want to be.
Global Fx Trading Group is a world leader in providing Fx services to individual traders, including: Unmatched funding programs, on-line education, virtual trading rooms, automation tools, robot building, and personal coaching.
The company was first established by Jeff Wecker, former member of the Chicago Board of Trade, with 25 years in the industry. Jeff has a keen understanding of the needs of Forex traders and those needs are our focus.
Please join our VIP Group while is still FREE …
https://t.me/joinchat/JqsXFBKpyj3YS4bLWzT_rg
Our mission is simple: To enhance as many lives as we can through education and empowerment.
#theforexarmy #forexsigns #forexsignals #forexfamily #forexgroup #forexhelp #forexcourse #forextrade #forexdaily #forexmoney #forexentourage #forextrading #forex #forexhelptrading #forexscalping #babypips #forexfactory #forexlife #forextrader #financialfreedom

