Outlook on August 10:
Analytical overview of popular currency pairs on the H1:
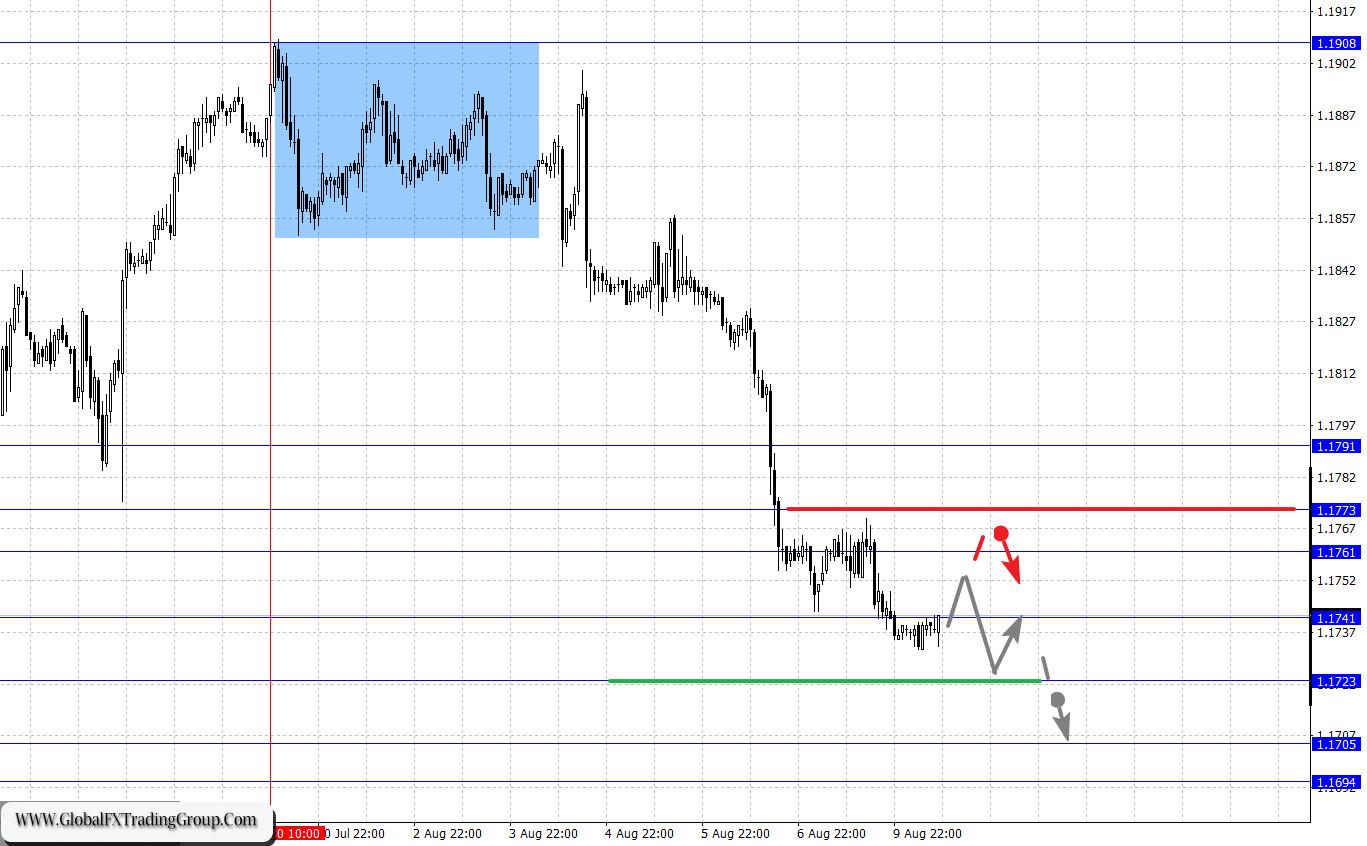
The key levels for the EUR/USD pair are 1.1791, 1.1773, 1.1761, 1.1741, 1.1723, 1.1705, and 1.1694. The price has been moving in a downward trend since July 30. Now, we expect a short-term decline in the 1.1741 – 1.1723 range. If the last value is broken, it will allow us to move to a potential target of 1.1694. After that, the price may consolidate in the range of 1.1705 – 1.1694, from which a pullback into a correction can be expected. A short-term growth, in turn, is likely in the range of 1.1761 – 1.1773. If the latter is broken, a deep correction will occur. The target is set at 1.1791, which is also the key support level.
The main trend is the downward trend from July 30.
Key levels of structure development:
Upward resistance: 1.1761 Target: 1.1772
Upward resistance: 1.1775 Target: 1.1790
Downward resistance: 1.1736 Target: 1.1724
Downward resistance: 1.1721 Target: 1.1705
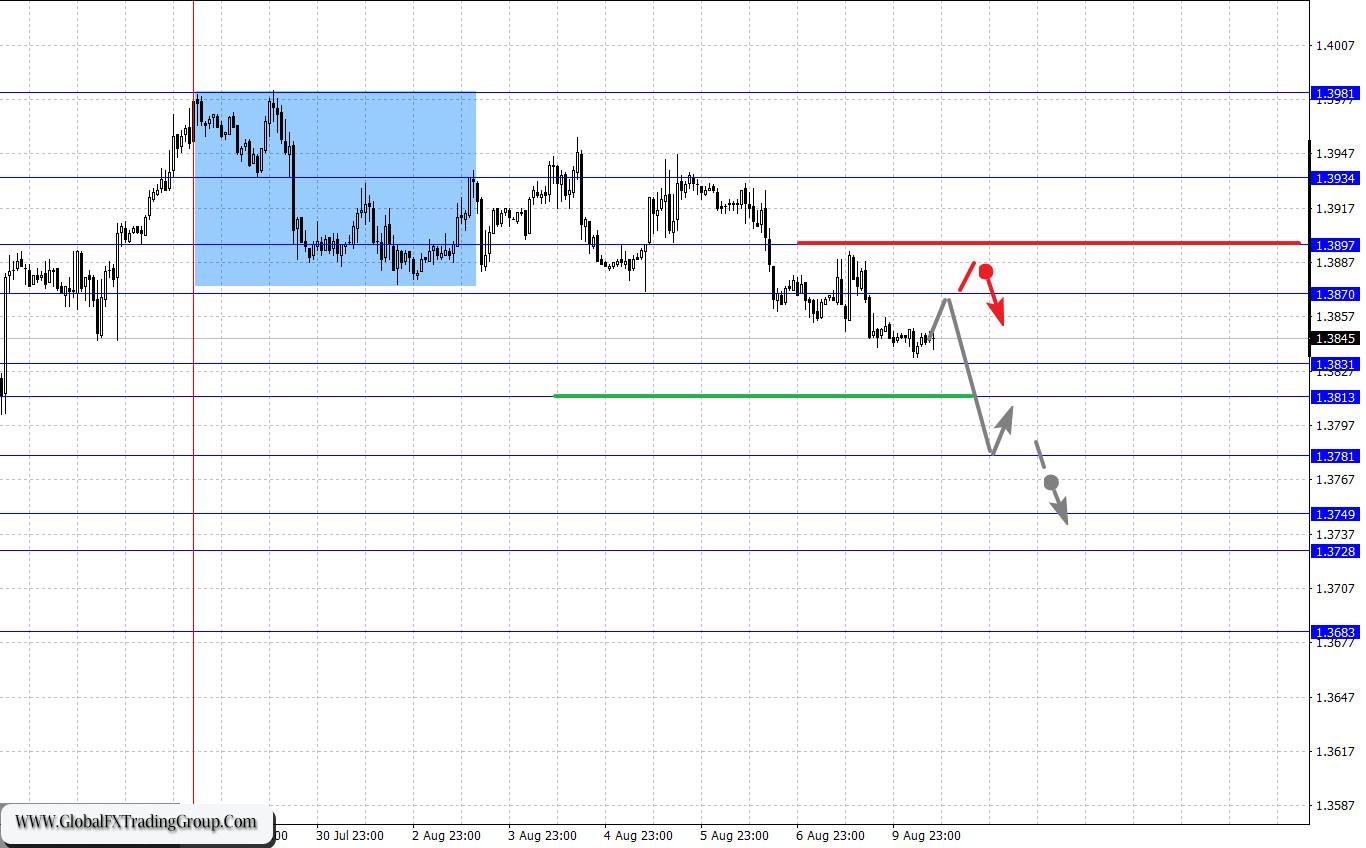
The key levels for the GBP/USD pair are 1.3934, 1.3897, 1.3870, 1.3831, 1.3813, 1.3781, 1.3749, 1.3728 and 1.3683. The further development of the downward trend from July 29 is expected after the price breaks through the noise range of 1.3831 – 1.3813. The target is set at 1.3781 and the price may consolidate around it. If the indicated target is broken, it will lead to a strong decline to the next target of 1.3749. After that, the price may consolidate in the range of 1.3749 – 1.3728. The ultimate potential downward target is 1.3683. After reaching it, an upward pullback can be expected. Short-term growth is expected in the range of 1.3870 – 1.3897. If the last value is broken, a deep correction will occur. The target is set at 1.3934, which is also the key support level.
The main trend is the downward trend from July 29.
Key levels of structure development:
Upward resistance: 1.3870 Target: 1.3895
Upward resistance: 1.3899 Target: 1.3934
Downward resistance: 1.3813 Target: 1.3781
Downward resistance: 1.3779 Target: 1.3750
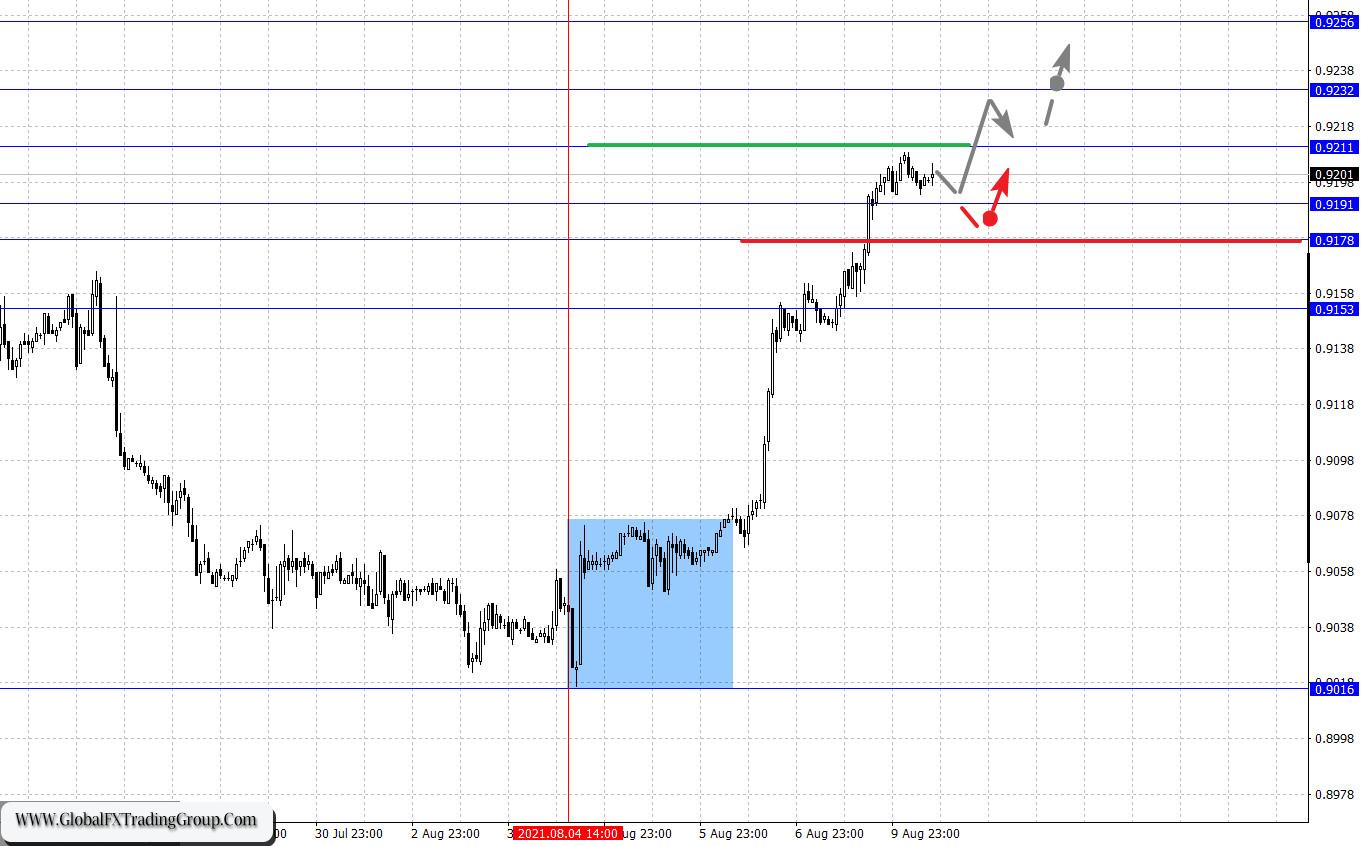
The key levels for the USD/CHF pair are 0.9256, 0.9232, 0.9211, 0.9191, 0.9178 and 0.9153. The price has been moving in a bullish trend since August 4. We expect this trend to extend after the level of 0.9211 is broken. The target is set at 0.9232 and the price may consolidate near it. The final potential upward target is 0.9256. After reaching it, a downward pullback can be expected. A short-term decline is possible in the range of 0.9191 – 0.9178. If the latter is broken, a deep correction will occur. The target is set at 0.9153, which is also the key support level.
The main trend is the upward trend from August 4.
Key levels of structure development:
Upward resistance: 0.9211 Target: 0.9231
Upward resistance: 0.9234 Target: 0.9256
Downward resistance: 0.9191 Target: 0.9178
Downward resistance: 0.9176 Target: 0.9155
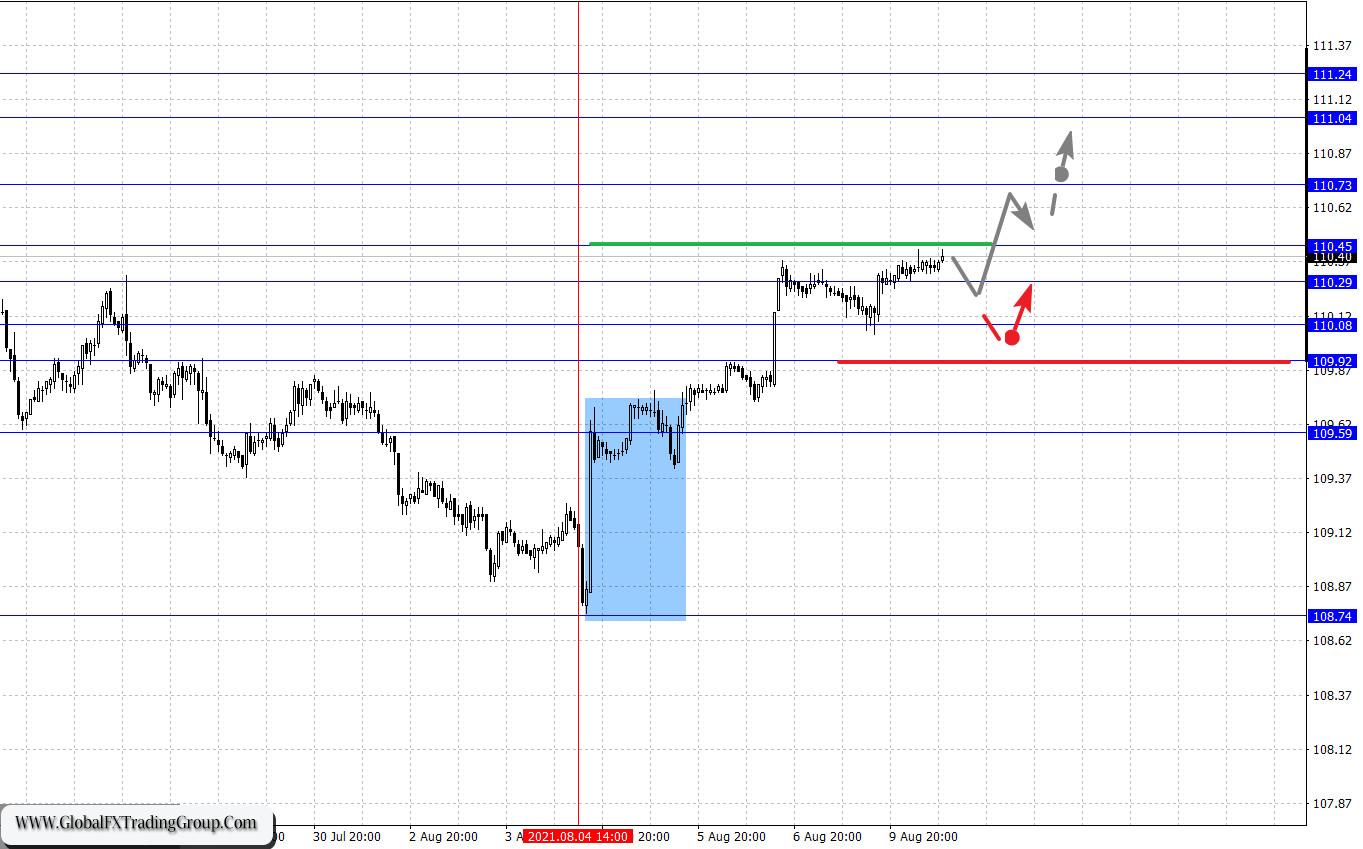
The key levels for the USD/JPY pair are 111.24, 111.04, 110.73, 110.45, 110.29, 110.08, 109.92, and 109.59. The price has been moving in an upward trend since August 4. We expect this trend to continue after the price breaks through the noise range of 110.29 – 110.45. The target is set at 110.73 and the price can consolidate near it. If the level of 110.75 is broken, it will lead to strong growth to the target of 111.04. The final potential upward target is 111.24. After reaching it, the price may consolidate and pull back downwards. A short-term decline can be expected in the 110.08 – 109.92 range. If the latter is broken, it will lead to a deep correction. The target is set at 109.59, which is also the key support level.
The main trend is the upward trend from August 4.
Key levels of structure development:
Upward Resistance: 110.45 Target: 110.71
Upward resistance: 110.75 Target: 111.04
Downward resistance: 110.08 Target: 109.93
Downward resistance: 109.90 Target: 109.61
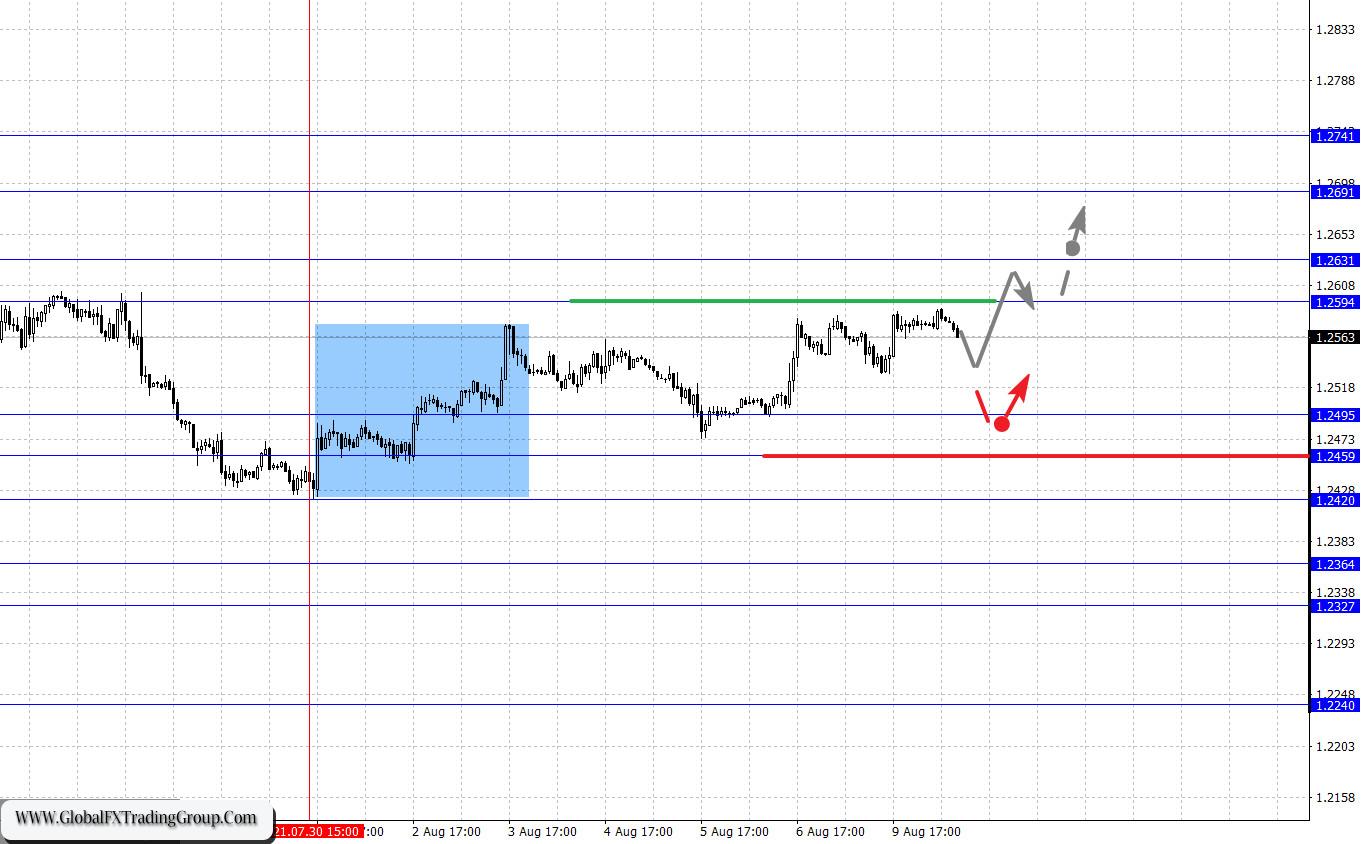
The key levels for the USD/CAD pair are 1.2741, 1.2691, 1.2631, 1.2594, 1.2495, 1.2459, 1.2420, 1.2364, 1.2327 and 1.2240. We are following the formation of the bullish trend from July 30. We expect the development of an upward trend after the level of 1.2594 is broken. The first target is set at 1.2631 and the price may consolidate close to it. If the first target is broken, it should be accompanied by strong growth to the next target of 1.2691. The ultimate potential upward target is 1.2741. After reaching it, a downward pullback can be expected. Meanwhile, a short-term decline is likely in the 1.2495 – 1.2459 range. If the last value is broken, it will dispose to the subsequent development of the downward trend from July 19. The first target is 1.2420.
The main trend is the upward trend from July 30.
Key levels of structure development:
Upward resistance: 1.2594 Movement target: 1.2630
Upward resistance: 1.2632 Movement target: 1.2690
Downward resistance: 1.2495 Movement target: 1.2462
Downward resistance: 1.2457 Movement target: 1.2365
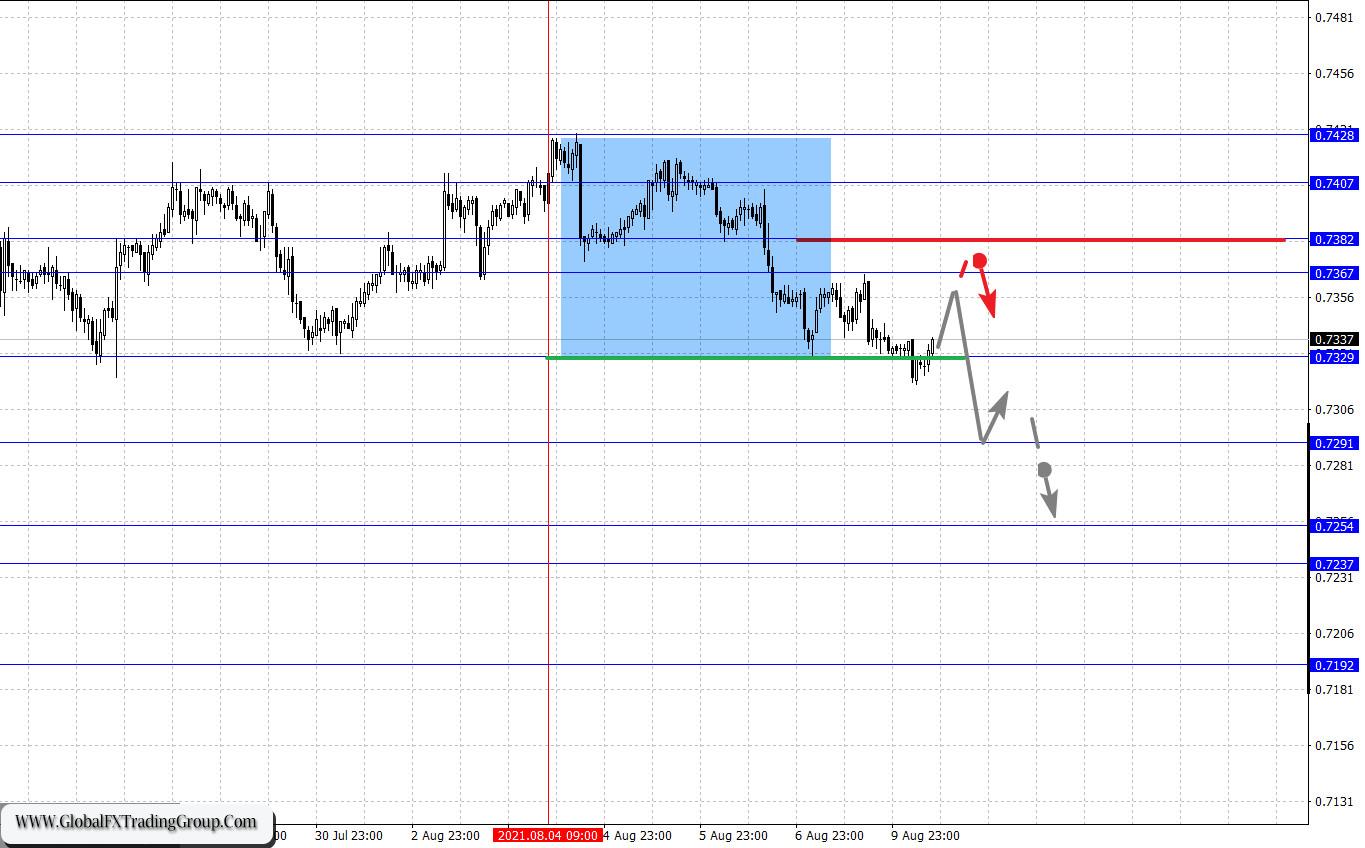
The key levels for the AUD/USD pair are 0.7428, 0.7407, 0.7382, 0.7367, 0.7329, 0.7291, 0.7254, 0.7237 and 0.7192. The price has been moving in a downward trend since August 4. We expect this trend to extend after the level of 0.7329 is broken. The target is set at 0.7291 and the price may consolidate near it. If the specified target is broken, it will lead to the development of a strong decline to the target of 0.7254. There is a short-term downward movement in the 0.7254 – 0.7237 range. The final potential downward target is 0.7192. After reaching it, an upward pullback can be expected. On the other hand, short-term growth is expected in the range of 0.7367 – 0.7382. If the latter is broken, a deep correction will occur. The target is 0.7407, which is also the key support level.
The main trend is the formation of a downward trend from August 4.
Key levels of structure development:
Upward resistance: 0.7367 Movement target: 0.7380
Upward resistance: 0.7384 Movement target: 0.7407
Downward resistance: 0.7327 Target of movement: 0.7293
Downward resistance: 0.7289 Target of movement: 0.7256
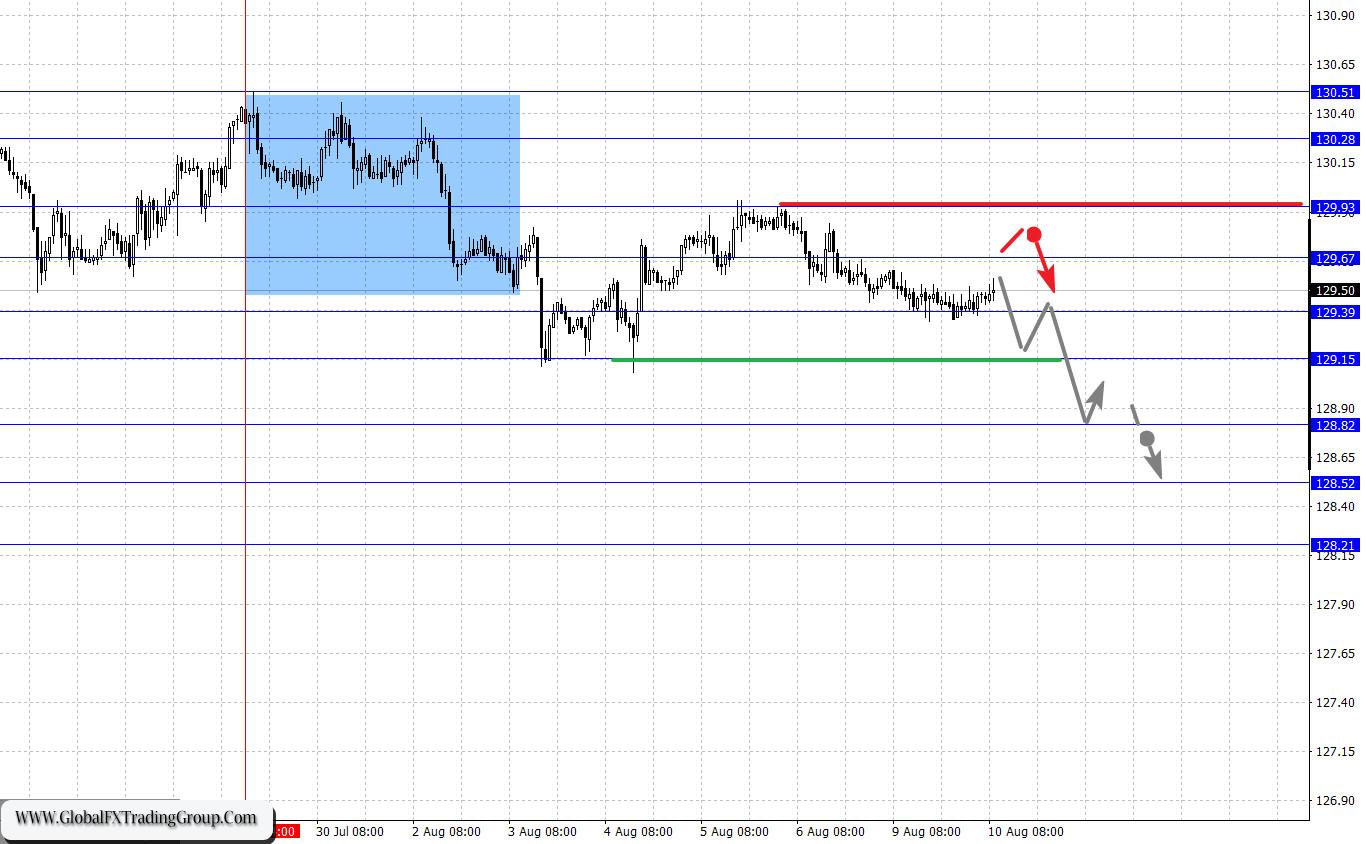
The key levels for the EUR/JPY pair are 130.51, 130.28, 129.93, 129.67, 129.39, 129.15, 128.82, 128.52, and 128.21. The price has been moving in a bearish trend since July 29, but it is currently in a correction. We expect this trend to continue after the breakdown of 129.39. The first target is set at 129.15. Its breakdown will continue the development of the main downward trend from July 29. Here, the target is 128.82, whose breakdown will allow us to move to the level of 128.52. The price may consolidate around it. The final potential downward target is 128.21. After reaching it, an upward pullback will occur. In turn, short-term growth is possible in the 129.67 – 129.93 range. If the last value is broken, it will encourage the formation of an upward trend. The first potential target is 130.28. We expect a short-term growth and consolidation in the range of 130.28 – 120.51.
The main trend is the downward trend from July 29, correction stage.
Key levels of structure development:
Upward resistance: 129.68 Movement target: 129.91
Upward resistance: 129.95 Movement target: 130.28
Downward resistance: 129.37 Target of movement: 129.16
Downward resistance: 129.13 Movement target: 128.84
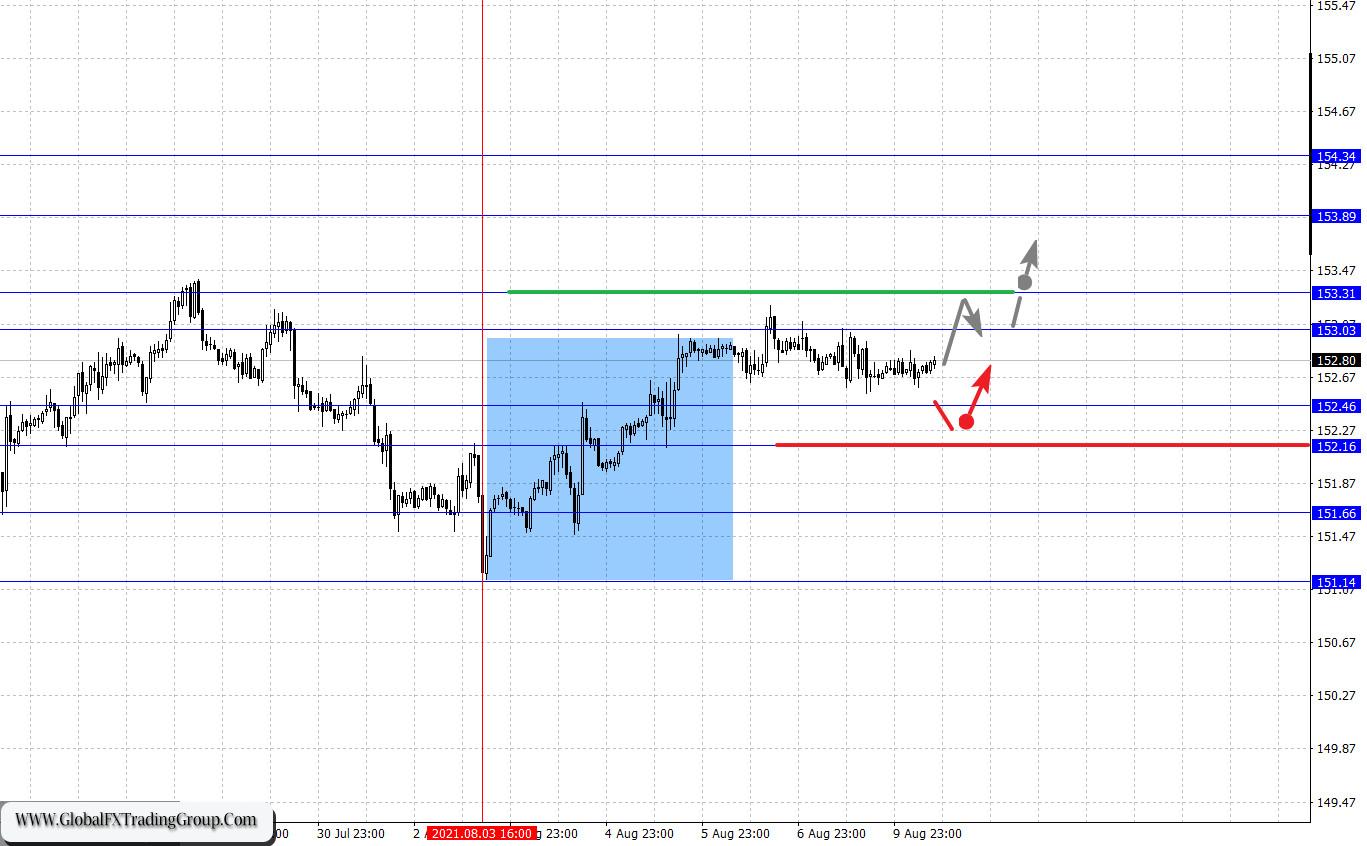
The key levels for the GBP/JPY pair are 154.34, 153.89, 153.31, 153.03, 152.46, 152.16, 151.66, and 151.14. We are following the development of the local upward trend from August 3. Now, we expect a short-term growth in the range of 153.03 – 153.31. If the latter is broken, strong growth will resume to the target of 153.89. The ultimate potential upward target is 154.34. After reaching it, the price may consolidate and pull back downwards. Alternatively, the short-term decline is possible in the range of 152.46 – 152.16. If the last value is broken, a deep correction will occur. The target is set at 151.66, which is also the key support level.
The main trend is the mid-term upward trend from July 20, deep correction stage.
Key levels of structure development:
Upward resistance: 153.03 Movement target: 153.30
Upward resistance: 153.36 Movement target: 153.89
Downward resistance: 152.45 Movement target: 152.17
Downward resistance: 152.12 Movement target: 151.70
*The market analysis posted here is meant to increase your awareness, but not to give instructions to make a trade.
If you have an interest in any area of Forex Trading, this is where you want to be.
Global Fx Trading Group is a world leader in providing Fx services to individual traders, including: Unmatched funding programs, on-line education, virtual trading rooms, automation tools, robot building, and personal coaching.
The company was first established by Jeff Wecker, former member of the Chicago Board of Trade, with 25 years in the industry. Jeff has a keen understanding of the needs of Forex traders and those needs are our focus.
Please join our VIP Group while is still FREE …
https://t.me/joinchat/JqsXFBKpyj3YS4bLWzT_rg
Our mission is simple: To enhance as many lives as we can through education and empowerment.
#theforexarmy #forexsigns #forexsignals #forexfamily #forexgroup #forexhelp #forexcourse #forextrade #forexdaily #forexmoney #forexentourage #forextrading #forex #forexhelptrading #forexscalping #babypips #forexfactory #forexlife #forextrader #financialfreedom

