Buy and sell levels for EUR/USD on February 4.
Analysis of trades.
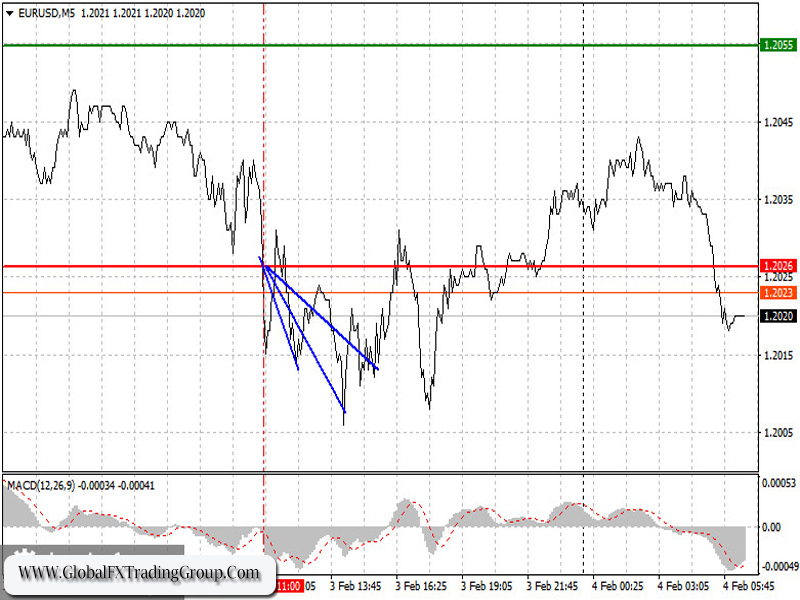
Analysis of trades Data on the eurozone services sector was well below the forecast. This resulted in good entry points for bears at the level of 1.2026. Earlier, I recommended traders to sell the euro after it broke the mentioned level. On the chart, we can see that at that moment, the MACD indicator was at the beginning of the negative level. This proved that we took the right decision to sell the euro. However, the pair was not very active. It dropped just by 20 pips. After that, it stopped and began recovering.

Today’s recommendations to enter and leave the market
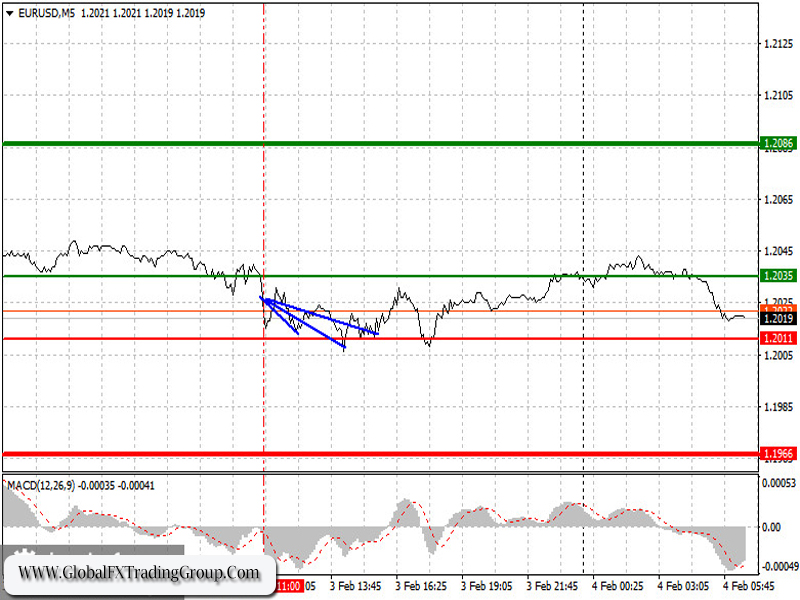
Today, reports from the eurozone that will be unveiled at the beginning of the day will be really important. In the second part of the day, the ECB will publish its economic Bulletin. Later, the eurozone will report on its retail sales. If the data significantly exceeds the forecast, the euro will have a change to rise against the US dollar. At the same time, the US dollar could become attractive for investors, if the US data on first-time claims and factory orders turns out to be strong. However, in this case, the euro may drop to its annual low of 1.1966.
Buy signals
Today, traders may buy the euro after it reaches the level of 1.2035 (a green line on the chart) with the target at 1.2086. At this level, it is better to close the position. The euro is likely to go on rising after strong figures on the eurozone retail sales for December 2020. Good news about the coronavirus vaccine will also lead to its advance. Importantly, before opening a buy position, please, make sure that the MACD indicator is above the zero level and begins its rise.
Sell signals
Traders may sell the euro after it hits the level of 1.2011 (a red line on the chart). The target is located at 1.1966. It is recommended to leave the market at this level. The euro will be under pressure only in case of weak retail sales data. Importantly, before opening sell positions, make sure that the MACD indicator is below the zero level and begins its fall.

On the chart:
- A thin green line is a level to enter the market to open buy positions.
- A thick green line is a price where it is possible to place the Take profit order or fix the profit manually. The price will hardly go above this level.
- A thin red line is a price to enter the market to open sell positions.
- A thick red line is a price where it is to place the Take profit order or fix the profit manually. The price will hardly go below this level.
- Indicator MACD. Traders should take into account the overbought and oversold zones when entering the market.
Beginning traders should be very careful making a decision to enter the market. It is better not to have opened oppositions at the moment of the fundamental data publication. At this moment, the pair could be extremely volatile. If you decide to trade during the news release, place a stop order to minimize your losses. Otherwise, you may lose all your money, especially if you do not use money management and prefer big trade size.
To become successful, traders should have an accurate trading plan. A knee-jerk decision based on the current market situation will surely lead to a failure in the day trading.
Buy and sell levels for GBP/USD on February 4.
Analysis of trades.
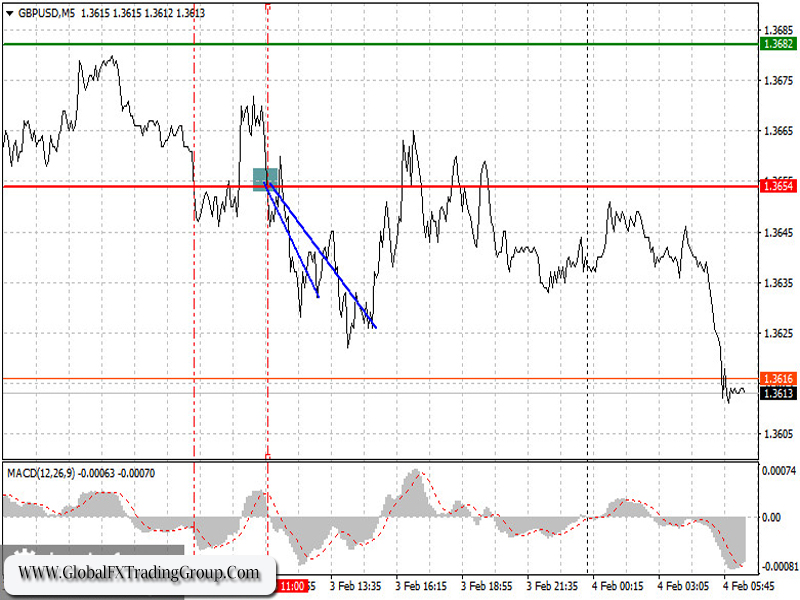
Yesterday, traders of the pound sterling received two signals to enter the market. On the chart, I highlighted these two points. We could ignore the first point to open sell positions at the level of 1.3654. The fact is that the MACD indicator had long been in the negative zone without any correction. This limited the downward potential of the pair. As a result, the British pound failed to show a significant decline. However, the second test of the level of 1.3654 led to a formation of a good entry point. At that moment, the MACD indicator had just moved to the negative zone. AS a result, the pound sterling slid by 30 pips.

Today’s recommendations to enter and leave the market
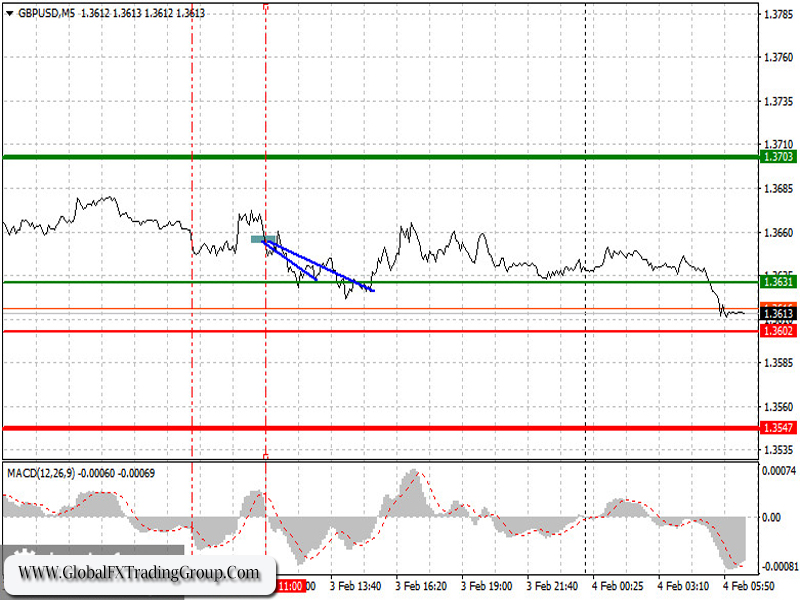
Today is a very important day for the pound sterling. The Bank of England will publish its meeting results. Early today, the UK will report on its business activity in the construction sector and the regulator will announce its key rate decision. A bit later, BoE Governor Andrew Bailey will provide a speech. If he hints on a possible cut of the key rate, the pound sterling will continue falling against the US dollar. Otherwise, the British pound may return to its annual high. At the same time, the US dollar could become attractive for investors, if the US data on first-time claims and factory orders turns out to be strong. However, in this case, the British pound may drop to its fresh low of 1.3545.
Buy signals
Today, traders may buy the pound sterling after it reached the entry point of 1.3631 (a green line on the chart). The target is 1.3703 (a thick green line on the chart). It is better to close buy positions at the level of 1.3703. Bulls may regain control over the market, if the Bank of England says nothing about negative rates. Importantly, before opening a buy position, please, make sure that the MACD indicator is above the zero level and begins its rise.
Sell signals
Today, traders may open sell positions on the pound sterling after it reached the level of 1.3602 again (a red line on the chart). This will lead to a sharp drop in the pair. The key target is 1.3547. At this level, it is recommended to leave the market. It is possible to sell the pound sterling after a break of the lower limit of the range. Statements about the likely introduction of negative interest rates in the UK will probably only increase the pressure on the British pound. Importantly, before selling, make sure that the MACD indicator is below the zero mark and zero level and begins its fall.

On the chart:
- A thin green line is a level to enter the market to open buy positions.
- A thick green line is a price where it is possible to place the Take profit order or fix the profit manually. The price will hardly go above this level.
- A thin red line is a price to enter the market to open sell positions.
- A thick red line is a price where it is to place the Take profit order or fix the profit manually. The price will hardly go below this level.
- Indicator MACD. Traders should take into account the overbought and oversold zones when entering the market.
Beginning traders should be very careful making a decision to enter the market. It is better not to have opened oppositions at the moment of the fundamental data publication. At this moment, the pair could be extremely volatile. If you decide to trade during the news release, place a stop order to minimize your losses. Otherwise, you may lose all your money, especially if you do not use money management and prefer big trade size.
To become successful, traders should have an accurate trading plan. A knee-jerk decision based on the current market situation will surely lead to a failure in the day trading.
*The market analysis posted here is meant to increase your awareness, but not to give instructions to make a trade.
If you have an interest in any area of Forex Trading, this is where you want to be.
Global Fx Trading Group is a world leader in providing Fx services to individual traders, including: Unmatched funding programs, on-line education, virtual trading rooms, automation tools, robot building, and personal coaching.
The company was first established by Jeff Wecker, former member of the Chicago Board of Trade, with 25 years in the industry. Jeff has a keen understanding of the needs of Forex traders and those needs are our focus.
Please join our VIP Group while is still FREE …
https://t.me/joinchat/JqsXFBKpyj3YS4bLWzT_rg
Our mission is simple: To enhance as many lives as we can through education and empowerment.
#theforexarmy #forexsigns #forexsignals #forexfamily #forexgroup #forexhelp #forexcourse #forextrade #forexdaily #forexmoney #forexentourage #forextrading #forex #forexhelptrading #forexscalping #babypips #forexfactory #forexlife #forextrader #financialfreedom

