To open long positions on EUR/USD, you need:
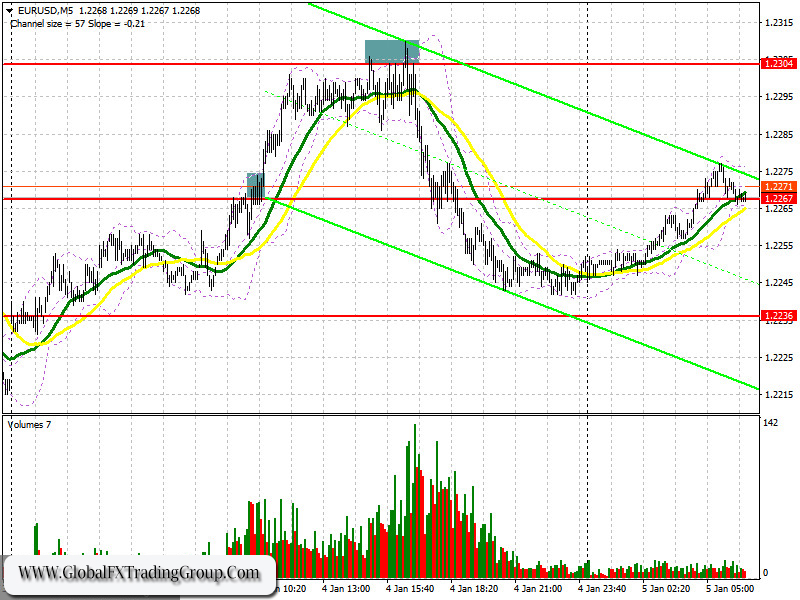
Several rather interesting signals to enter the market appeared yesterday. Let’s take a look at the 5-minute chart and break it down. The bulls took the 1.2267 level in the first half of the day after the release of reports on manufacturing activity in the eurozone countries were released. I have highlighted the area on the chart, where the signal to buy the euro was created after the breakout and how the price settled above this range.
The growth amounted to around 30 points to the resistance area of 1.2304, where I recommended taking profit. The bears formed an excellent false breakout of the 1.2304 level during the US session and returned EUR/USD under it, which led to forming an excellent entry point into short positions. The first downward wave resulted in returning the quote to the support area of 1.2267, where I recommended taking profits. In total, the downward movement was about 60 points.

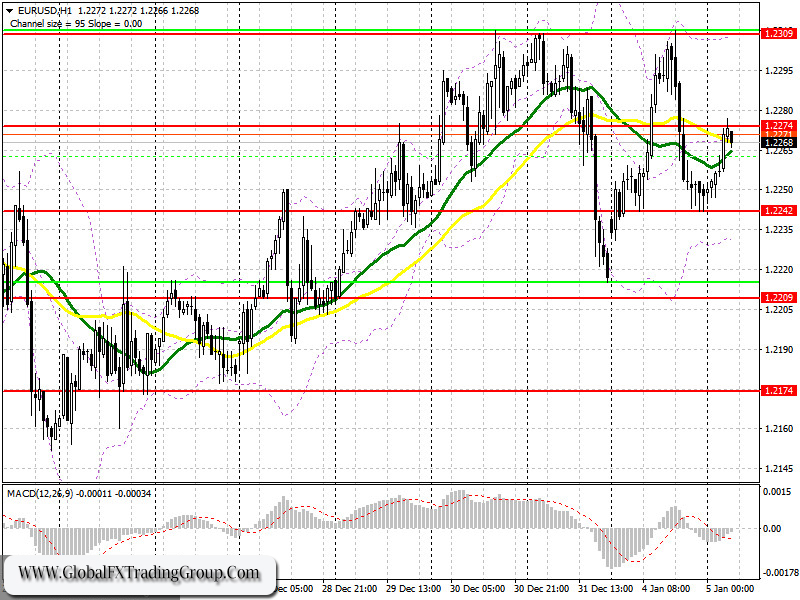
And although the nearest support and resistance levels have slightly changed, buyers’ tactics will most likely be the same as yesterday. The main task is to regain control over the 1.2274 level, as only this will make it possible to count on renewed demand for the European currency. A breakout and consolidation above this range and being able to test it from top to bottom (similar to the purchase, which I analyzed above) creates a good signal to open long positions.
The main task is to update last year’s high in the 1.2309 area. Surpassing this range will open a direct path to the area of 1.2339 and 1.2417, where I recommend taking profits. Data on the German labor market will be released today, which may harm the euro’s growth. In case of a downward correction, I recommend opening long positions only after a false breakout in the support area of 1.2242. A larger level for longs is seen in the 1.2209 area, from where you can open long positions immediately on a rebound, counting on an upward correction of 20-25 points within the day.
To open short positions on EUR/USD, you need:
Sellers of the euro aim to regain control over the 1.2242 level. Getting the pair to settle below this range and testing it from the other side will raise the pressure on the pair, which creates a good entry point for short positions. In this case, the main goal is to pull down EUR/USD to support at 1.2209, as well as to update a larger low around 1.2174, where I recommend taking profit. Testing this area will show that a downward correction is being formed and also indicate a complete reversal of the upward trend. An equally important task for the bears is to protect resistance at 1.2274, near which trade is now being conducted.
Weak data on the German labor market and the volume of lending to the private sector in the eurozone will certainly put pressure on the euro. Forming a false breakout at 1.2274 will be a signal to open new short positions. In case the pair grows above 1.2274, similar to yesterday, it is better not to rush to sell, but wait until last year’s high has been tested in the 1.2309 area and sell the euro there, counting on a downward correction of 25-30 points within the day.

Let me remind you that the Commitment of Traders (COT) report for December 21 recorded an increase in both short and long positions. Buyers of risky assets continue to believe in a bull market amid news that vaccination against the first strain of coronavirus has begun in Europe. However, there are still quite a few problems due to the quarantine measures taken after the detection of a new strain of Covid-19 that appeared recently in the UK. Thus, long non-commercial positions rose from 218,710 to 222,443, while short non-commercial positions jumped from 76,877 to 78,541. The total non-commercial net position rose from 141,833 to 143,902.
Indicator signals:
Moving averages
Trading is carried out in the area of 30 and 50 moving averages, which indicates the sideways nature of the market in the short term.
Note: The period and prices of moving averages are considered by the author on the H1 hourly chart and differs from the general definition of the classic daily moving averages on the D1 daily chart.
Bollinger Bands
In case the pair falls, support will be provided by the lower border of the indicator in the 1.2235 area. Only a breakout of the average border of the indicator in the 1.2309 area can cause the pair to rise.
Description of indicators
Moving average (moving average, determines the current trend by smoothing out volatility and noise). Period 50. It is marked in yellow on the chart. Moving average (moving average, determines the current trend by smoothing out volatility and noise). Period 30. It is marked in green on the chart. MACD indicator (Moving Average Convergence/Divergence — convergence/divergence of moving averages) Quick EMA period 12. Slow EMA period to 26. SMA period 9
Bollinger Bands (Bollinger Bands). Period 20 Non-commercial speculative traders, such as individual traders, hedge funds, and large institutions that use the futures market for speculative purposes and meet certain requirements. Long non-commercial positions represent the total long open position of non-commercial traders. Short non-commercial positions represent the total short open position of non-commercial traders. Total non-commercial net position is the difference between short and long positions of non-commercial traders.
*The market analysis posted here is meant to increase your awareness, but not to give instructions to make a trade.
If you have an interest in any area of Forex Trading, this is where you want to be.
Global Fx Trading Group is a world leader in providing Fx services to individual traders, including: Unmatched funding programs, on-line education, virtual trading rooms, automation tools, robot building, and personal coaching.
The company was first established by Jeff Wecker, former member of the Chicago Board of Trade, with 25 years in the industry. Jeff has a keen understanding of the needs of Forex traders and those needs are our focus.
Please join our VIP Group while is still FREE …
https://t.me/joinchat/JqsXFBKpyj3YS4bLWzT_rg
Our mission is simple: To enhance as many lives as we can through education and empowerment.
#theforexarmy #forexsigns #forexsignals #forexfamily #forexgroup #forexhelp #forexcourse #forextrade #forexdaily #forexmoney #forexentourage #forextrading #forex #forexhelptrading #forexscalping #babypips #forexfactory #forexlife #forextrader #financialfreedom

