Trade Detector” from Global Fx Trading Group
Global FX Trading Group
Trade Detector Algorithm
“Trade Detector Algo” from Global Fx Trading Group |
Jeff Wecker was the leading trader (among 100 top international pros) on the well known international, SEC licensed platform, Ticker Tocker from 2016-2021. You can see Jeff's strategies using Trade Detector on YOU TUBE....just search Jeff Wecker.
Jeff is plus about 190% over the past 12 months and that performance ranks him among the top traders worldwide. Now we’re making the software available that helped propel him to this position.
Trade Detector is highly sophisticated underneath, but extremely easy to use. Its indicators track overbought and oversold conditions, divergence, momentum, volume, fractals (rhythms in the market), support resistance, and trend. All of that is done for you leaving you free to simply watch the green buy signals and red sell signals.
The system can run on MT4 and MT5. It works on all assets including stocks, stock indices, bonds, Bitcoin, all Commodities and Fx. It answers the following questions for both the novice and experienced trader:
- What is the lowest risk entry point for a particular trade,
- What is the exact proper price and time to enter the trade at (if you don’t know this, your destiny is to be stopped out, lose money, and miss the move, all at the same time.)
- When do I take partial profits, place stops on what I keep, and put myself into a free trade,
- How and where do I use trailing stops to guarantee profits; and at the same time stay in the trade if it continues in my direction.
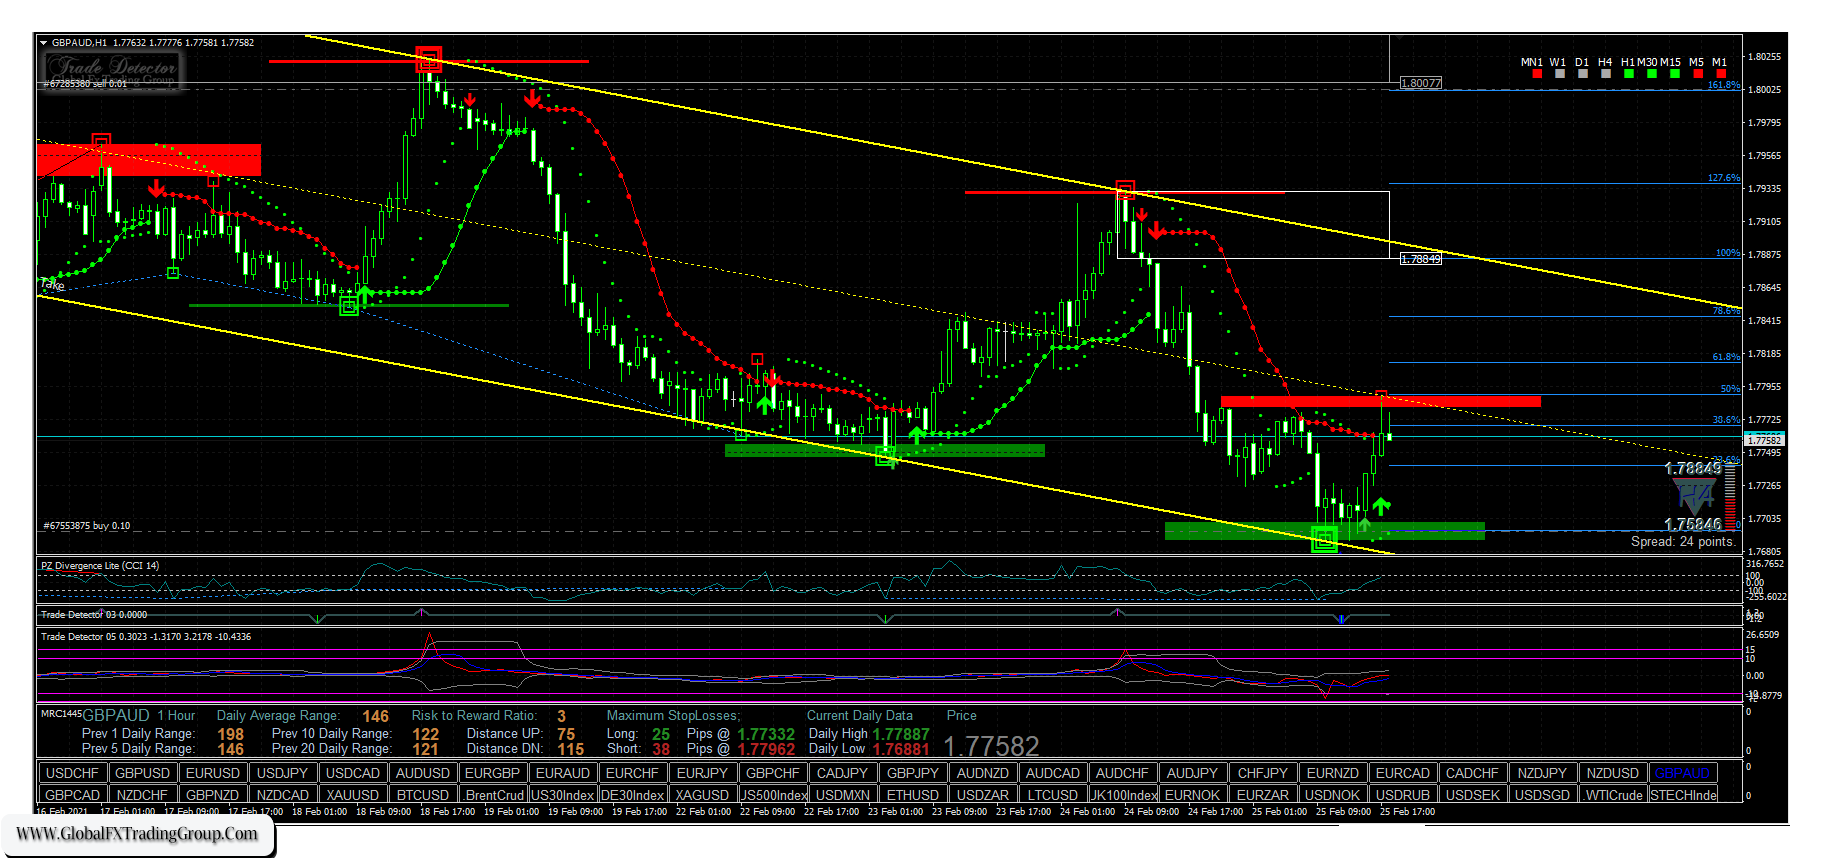
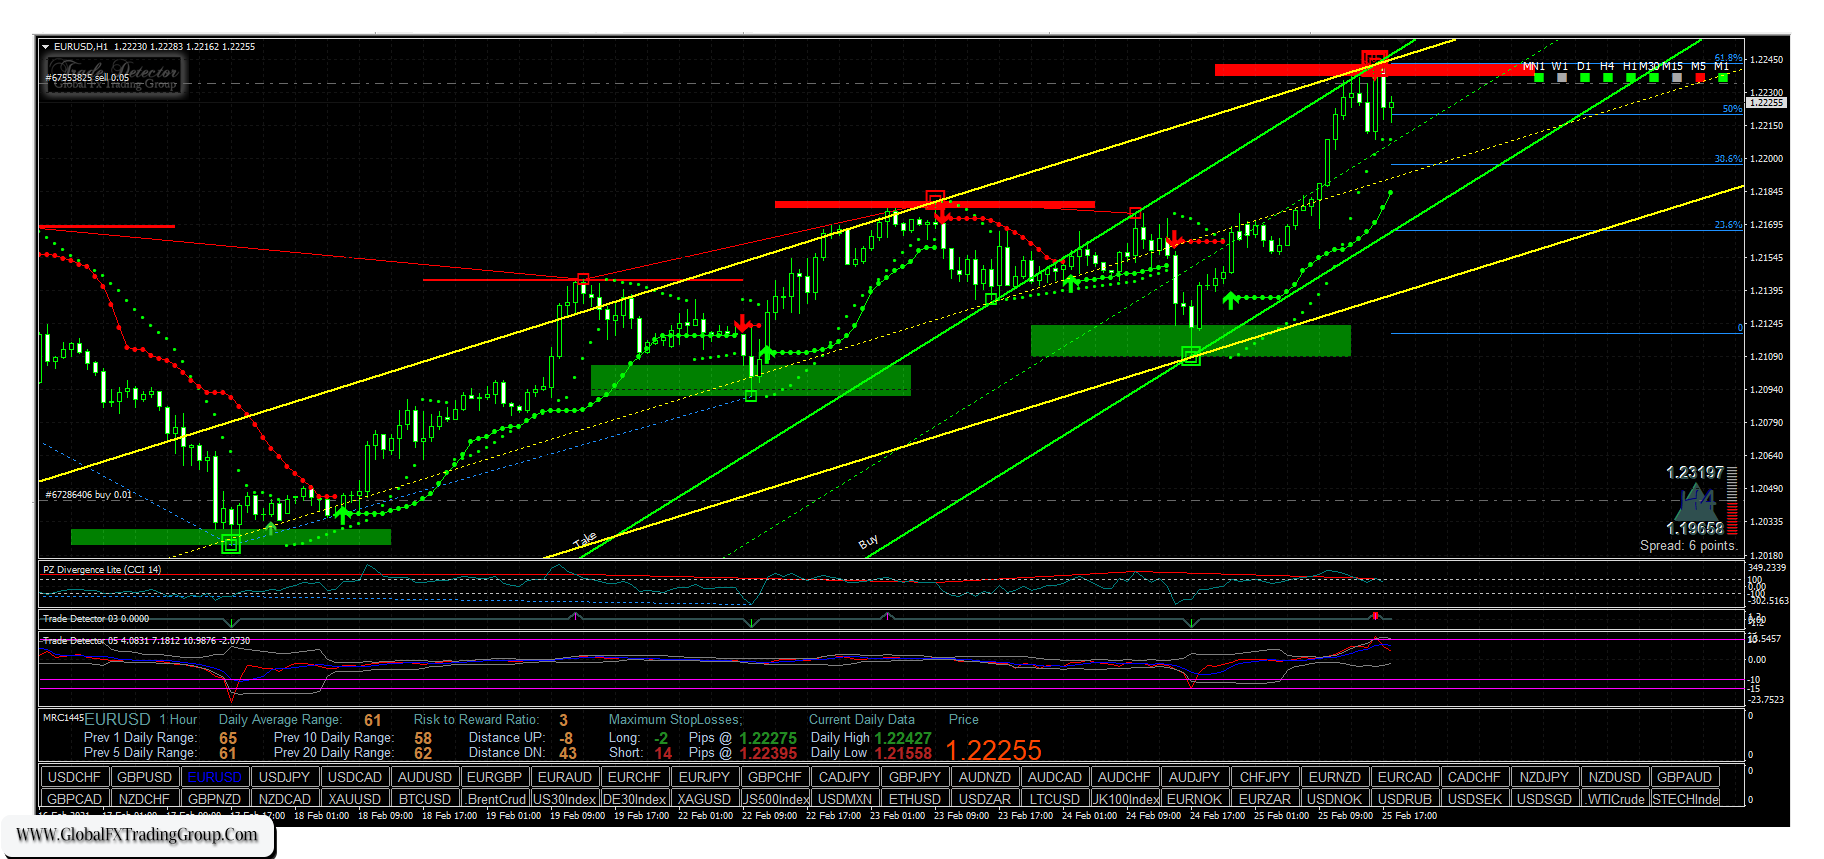
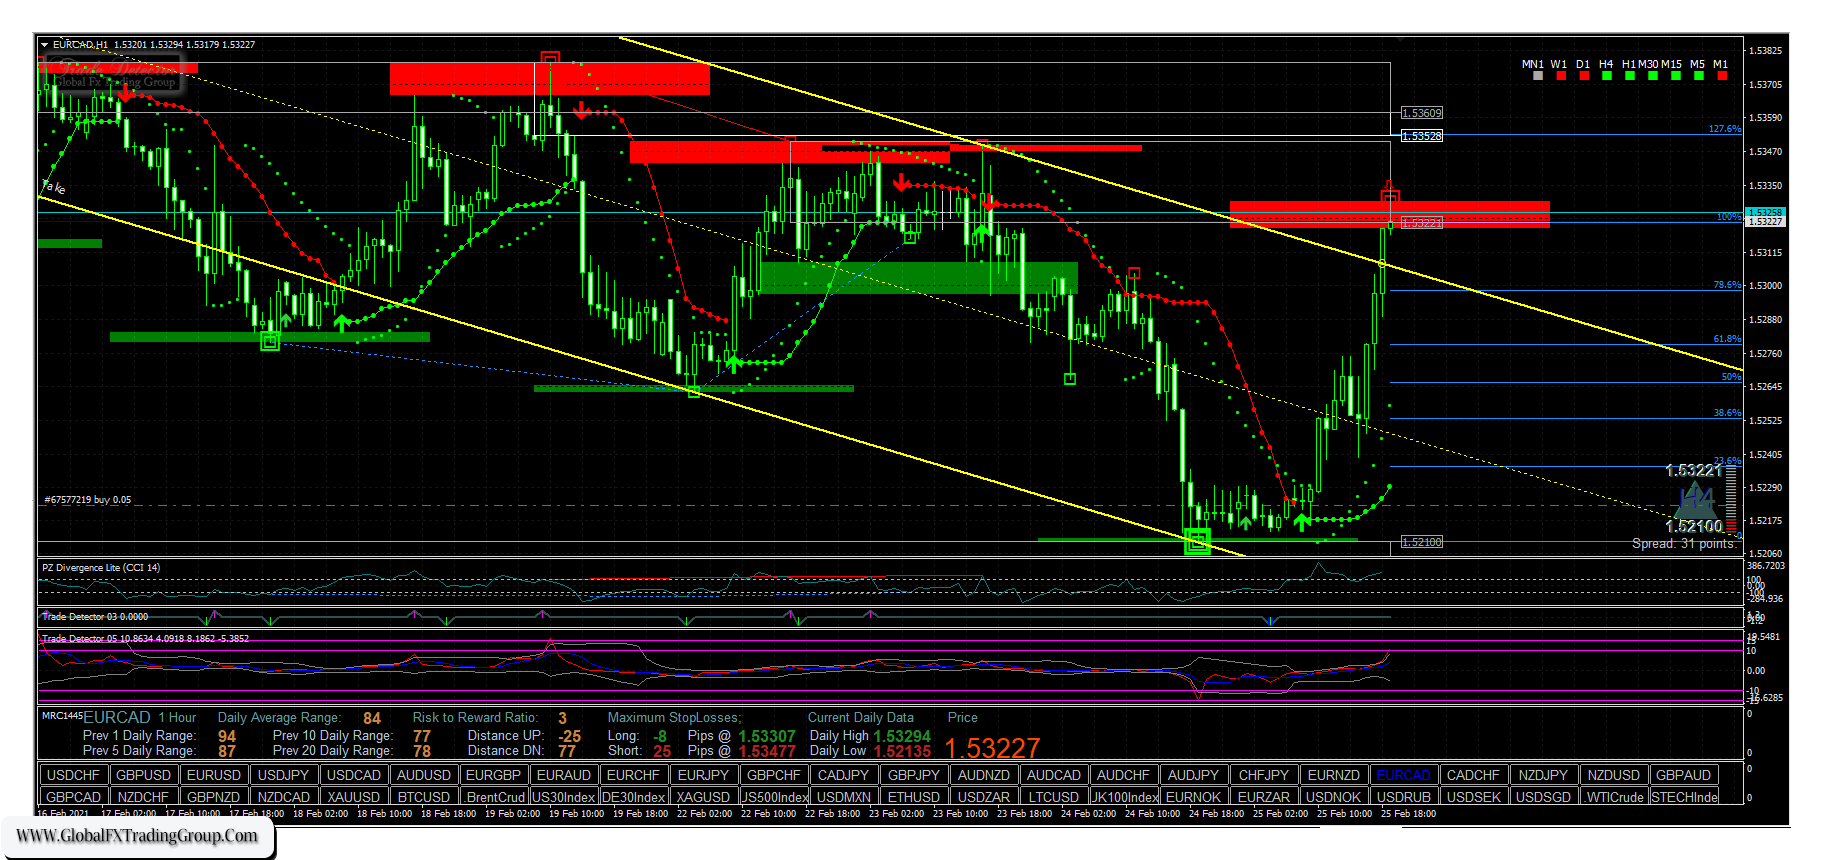
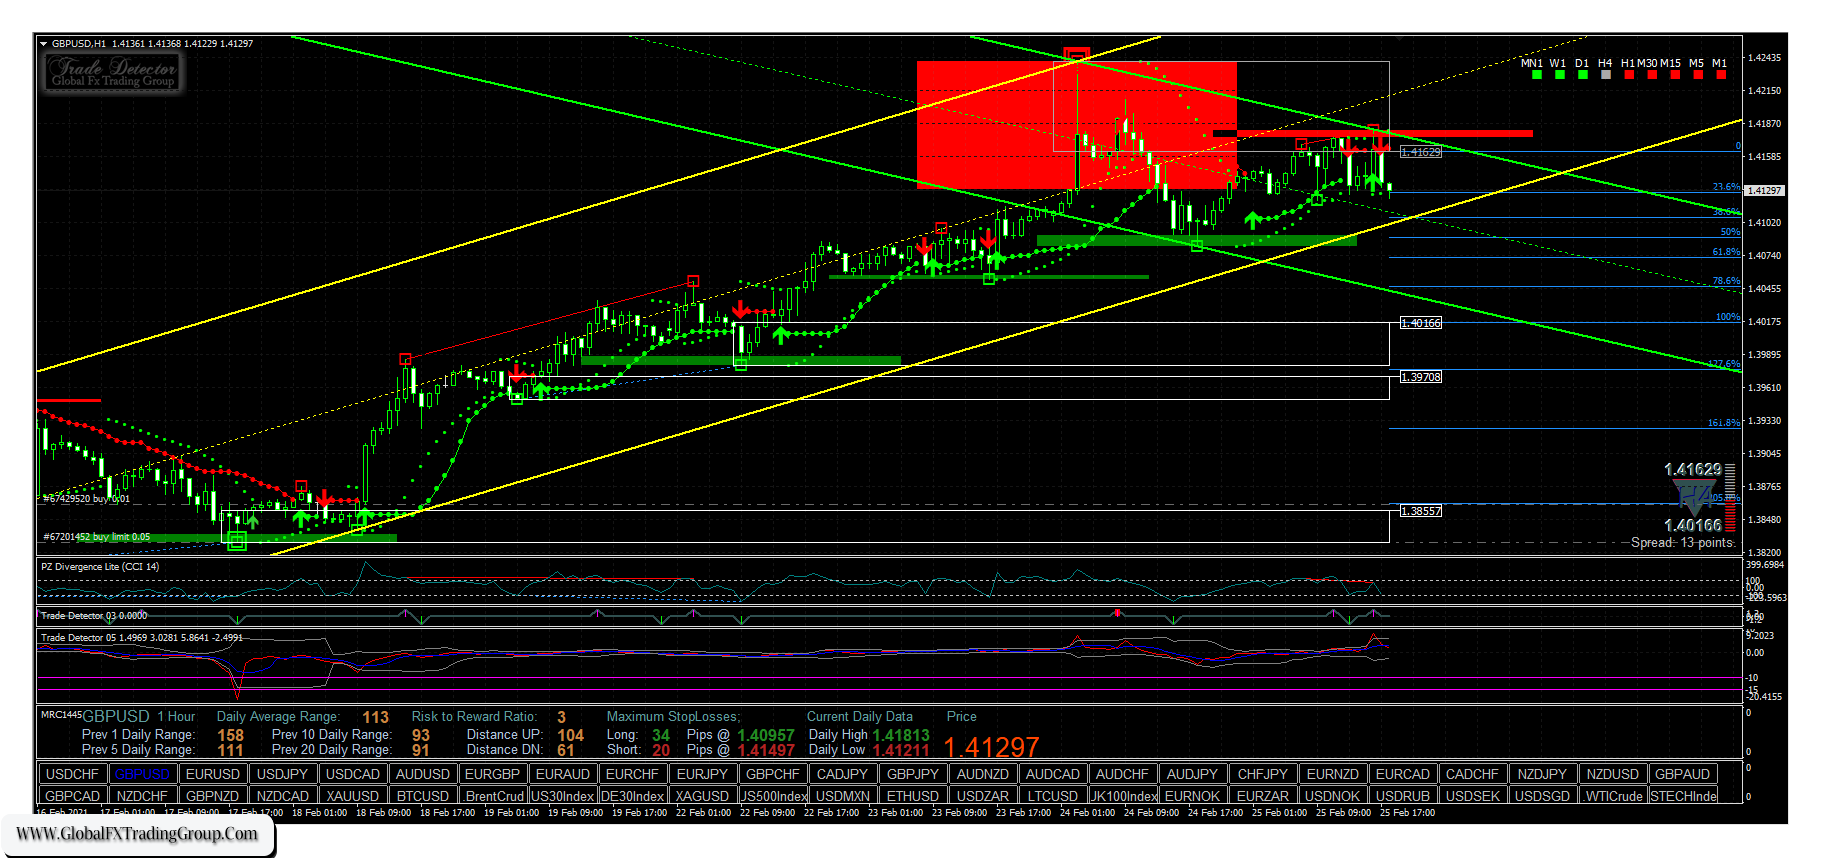
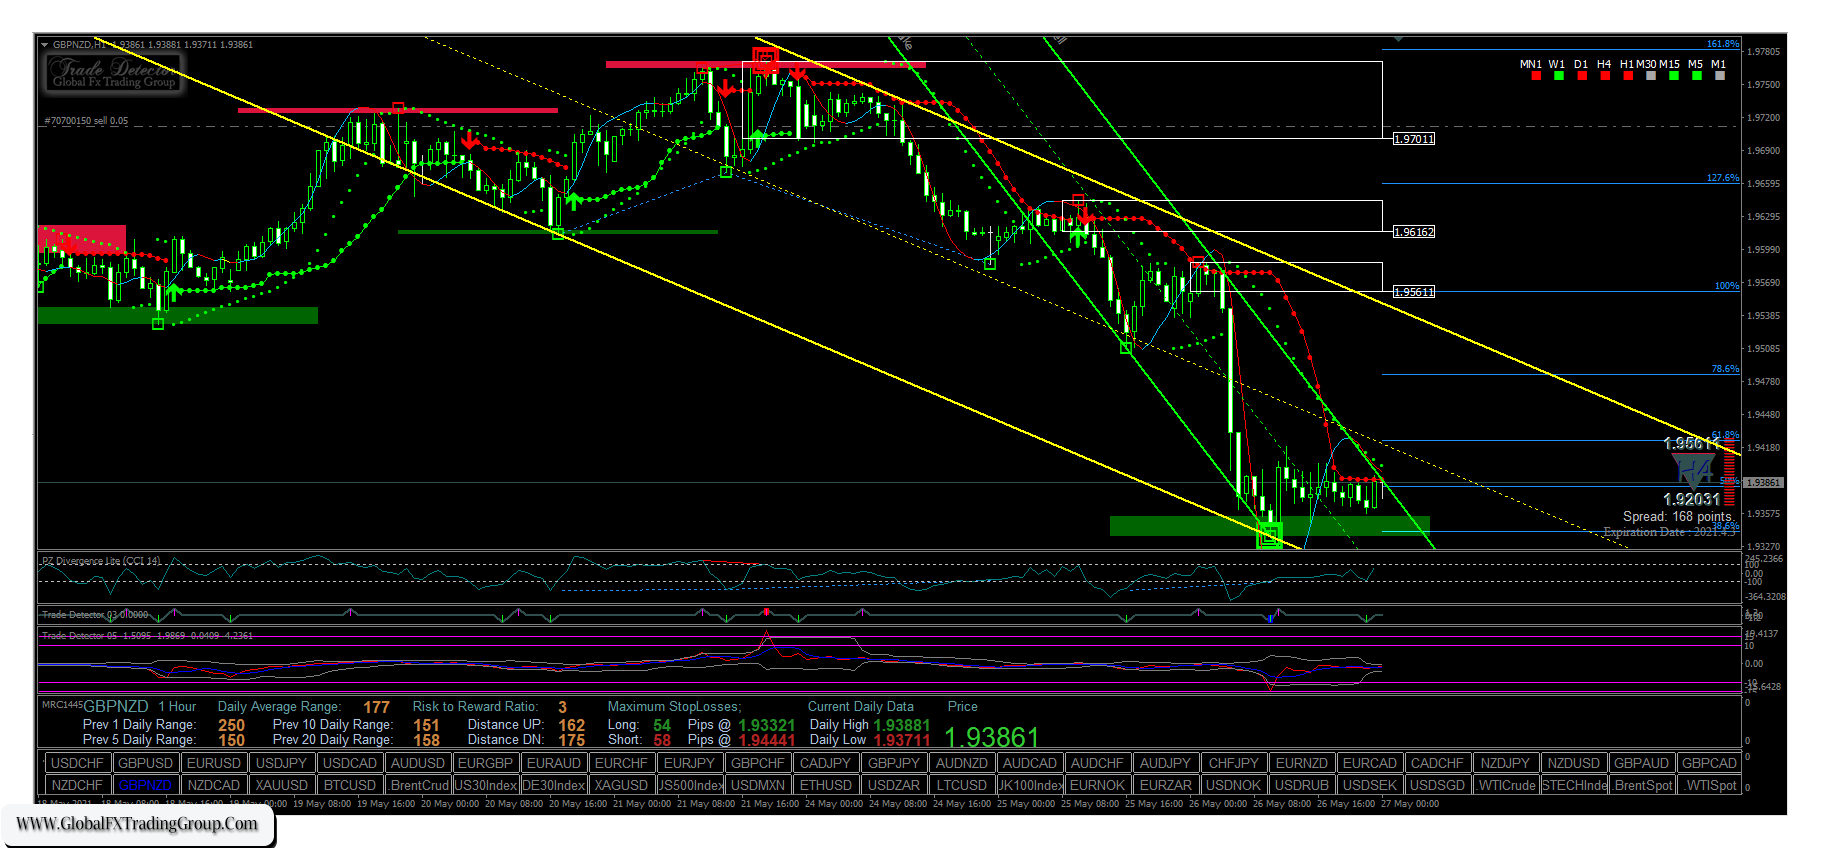
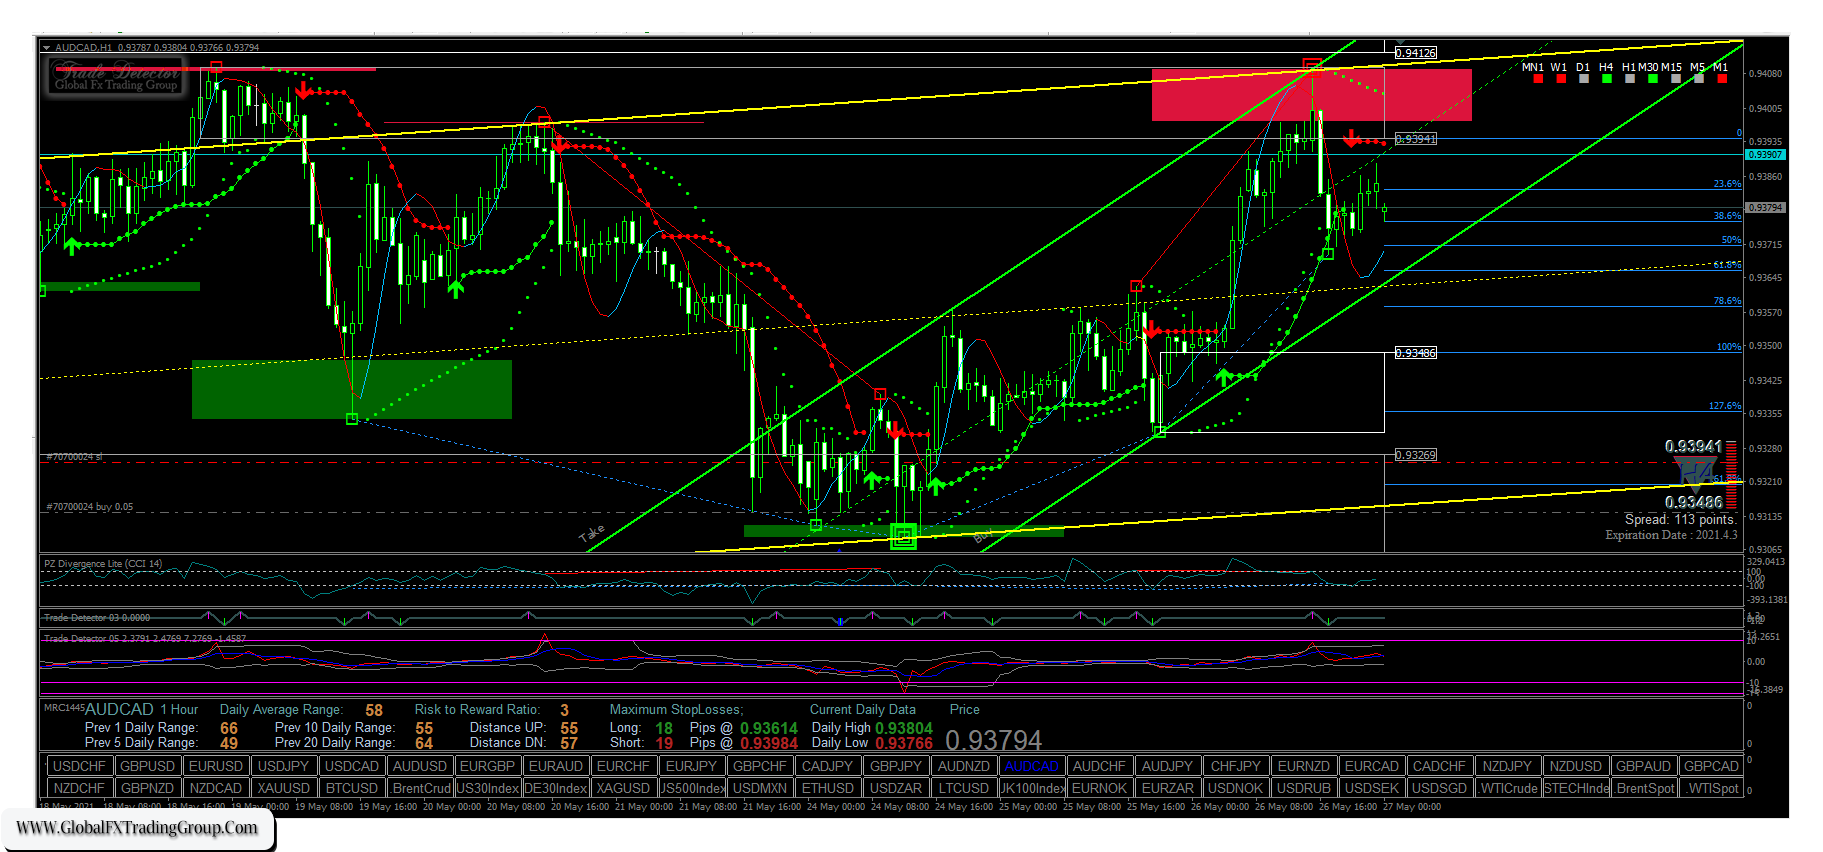
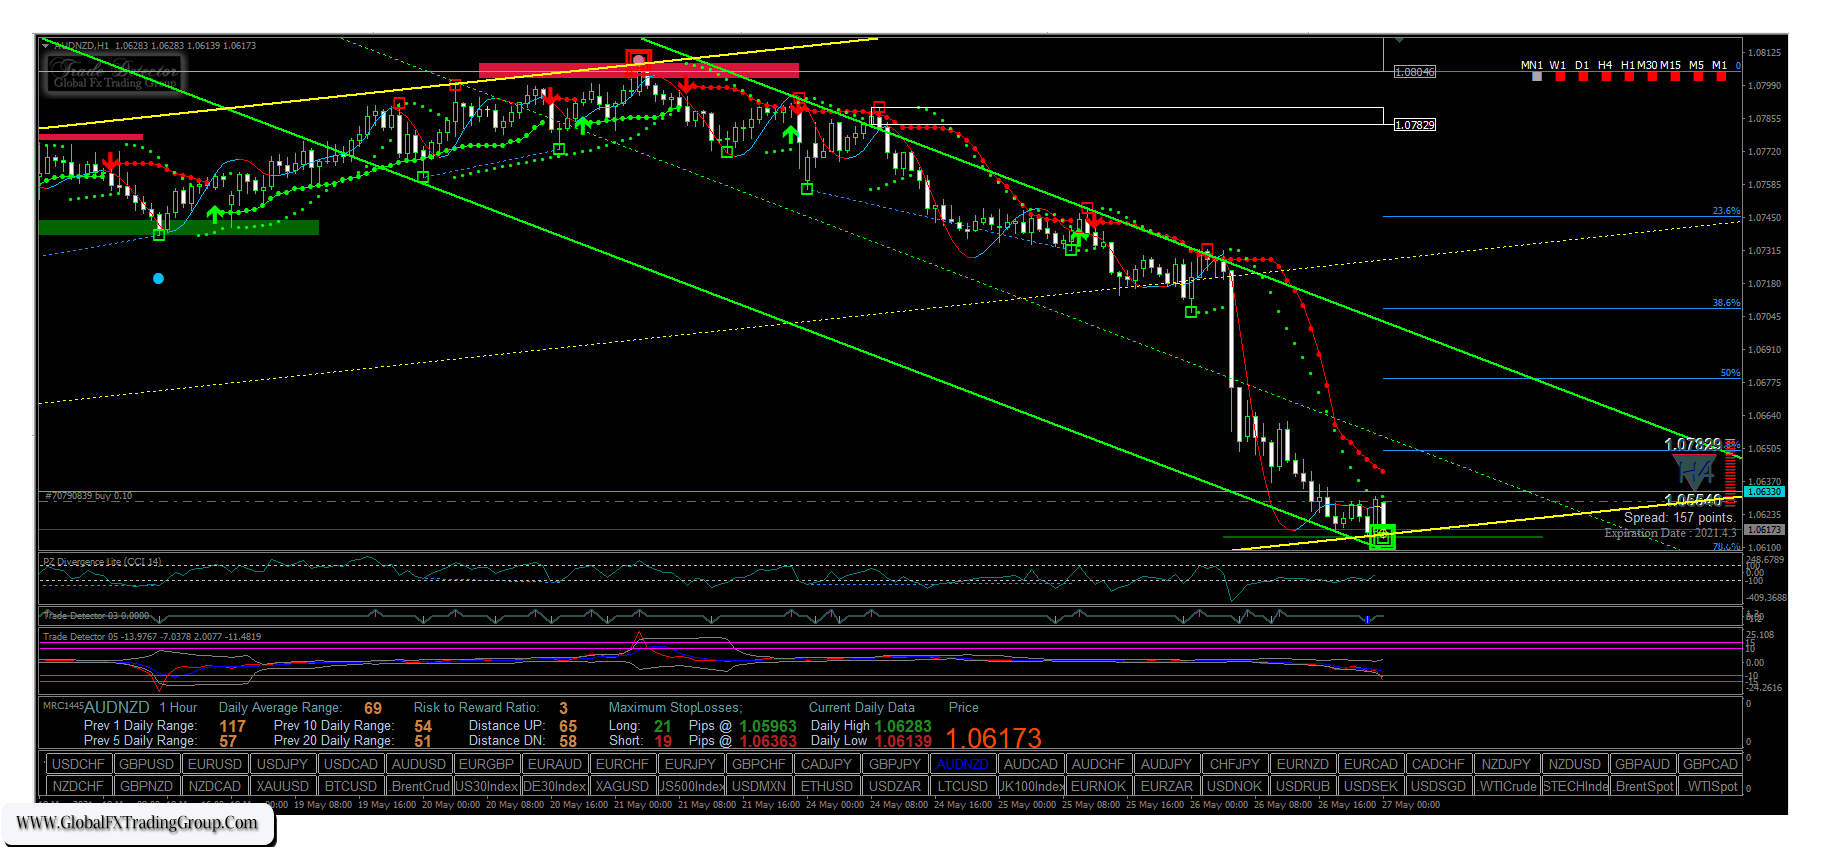
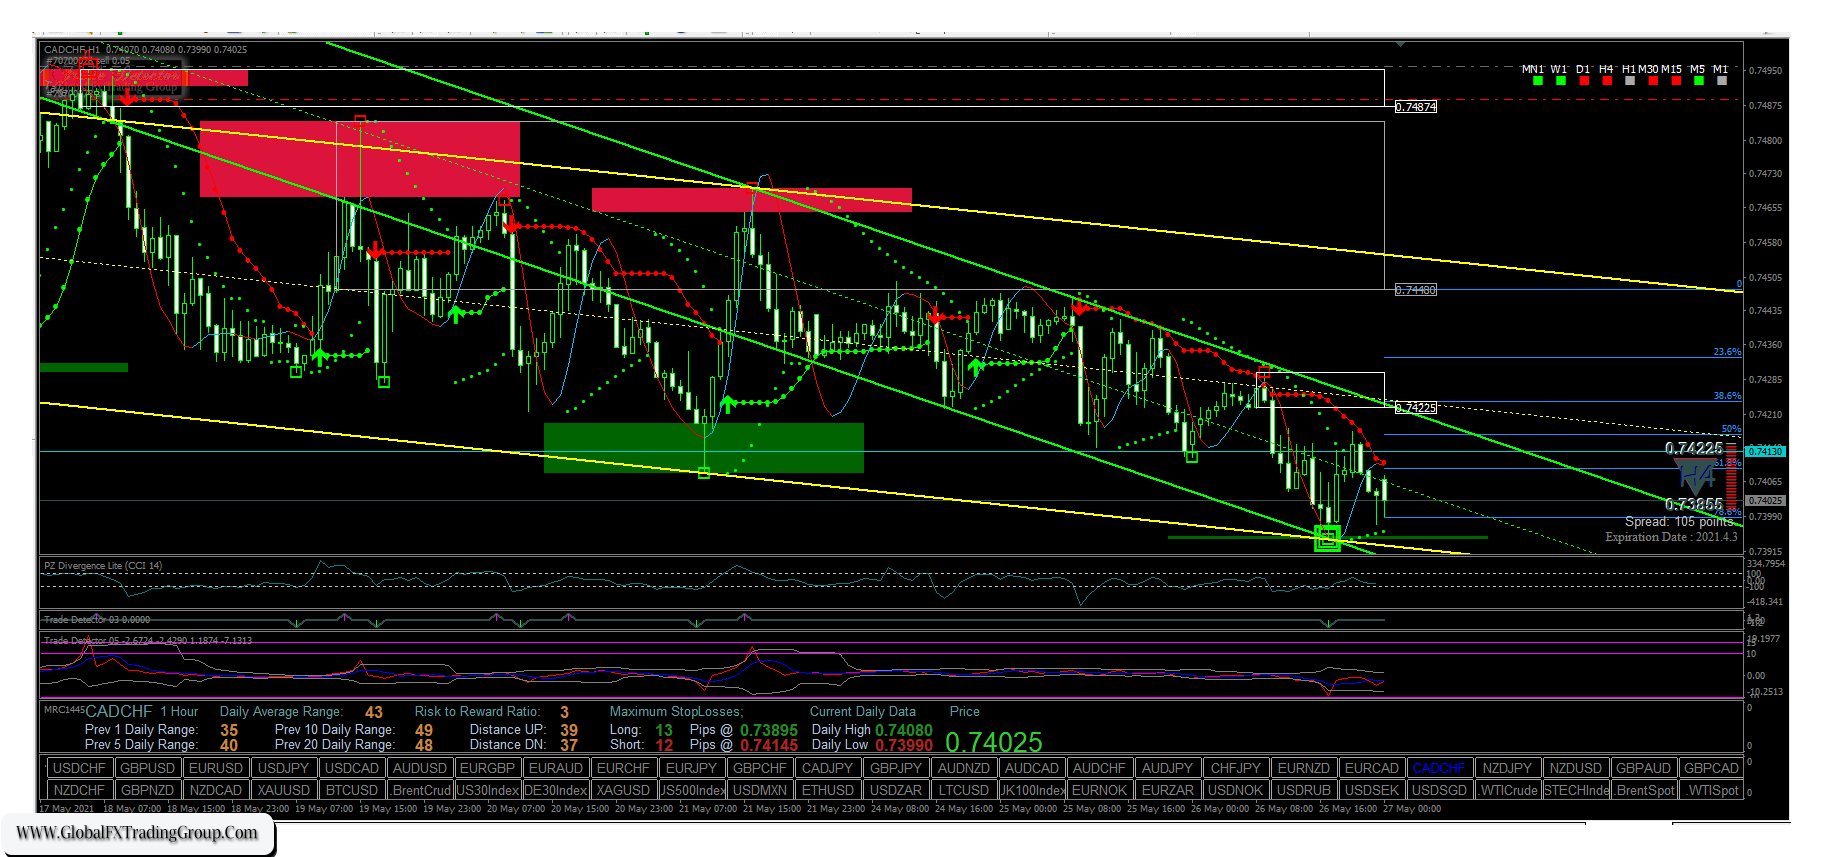
Let’s look at a screen shot to see how this all comes together. Weekly and daily charts will give you the longer term trades and the same principles will give you day trades on 5 and 15 minute charts.
GBP/AUD 1 Hour Chart
EUR/USD 1 Hour Chart
EUR/CAD 1 Hour Chart
GBP/USD 1 Hour Chart
GBP/NZD 1 Hour Chart
AUD/CAD 1 Hour Chart
AUD/NZD 1 Hour Chart
CAD/CHF 1 Hour Chart
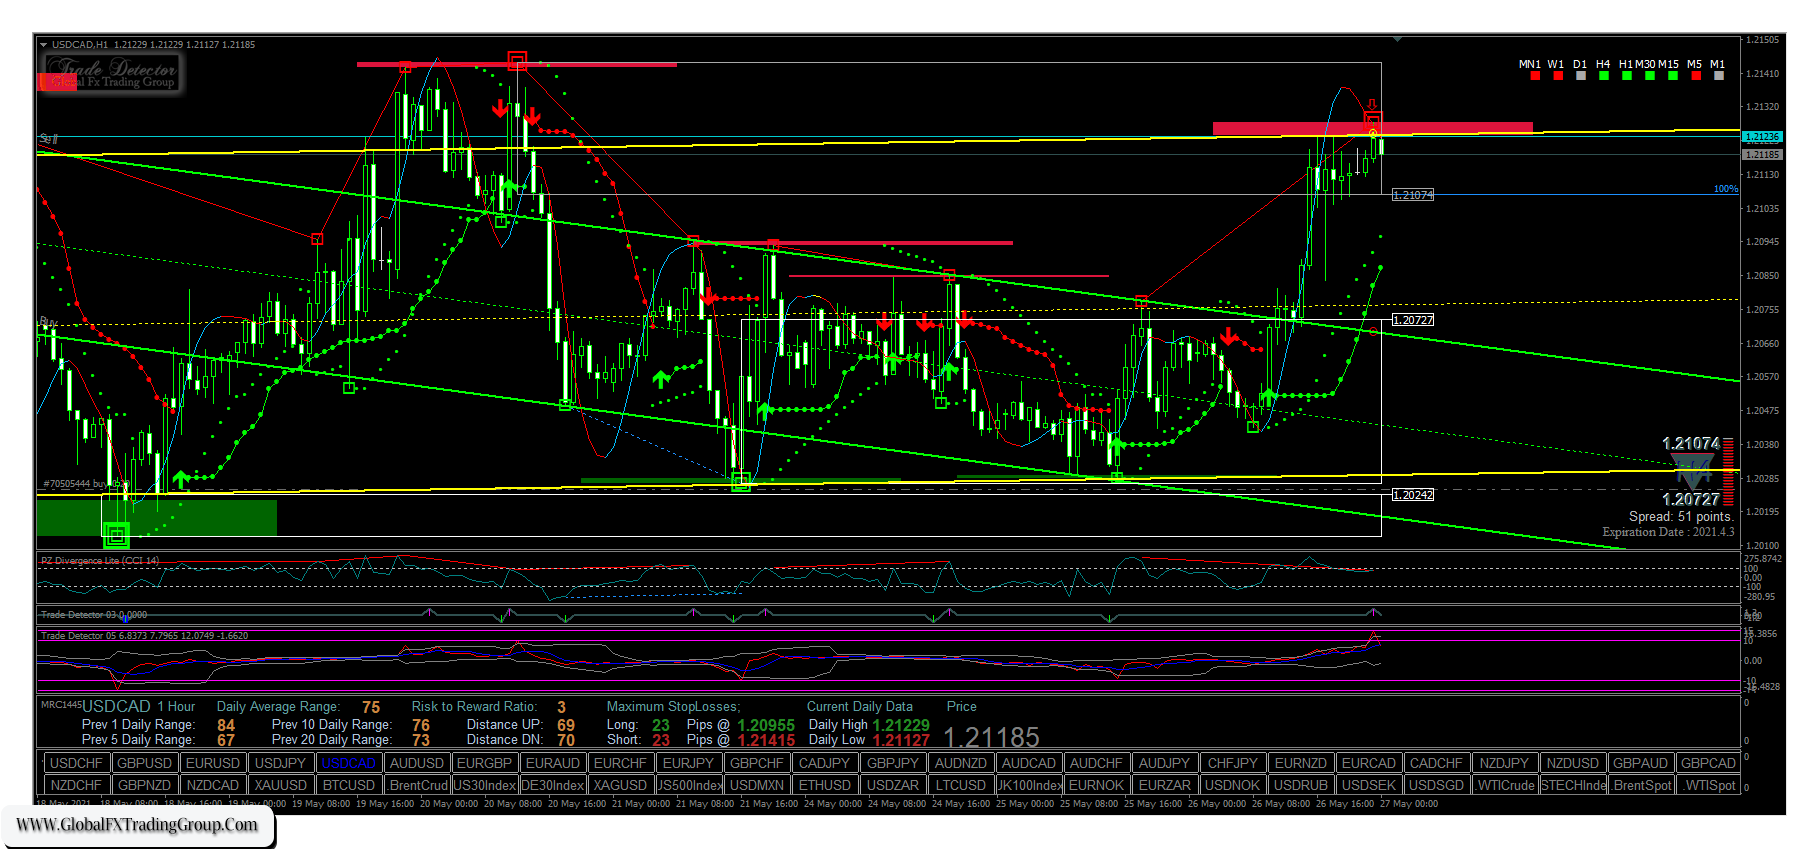
USD/CAD 1 Hour Chart
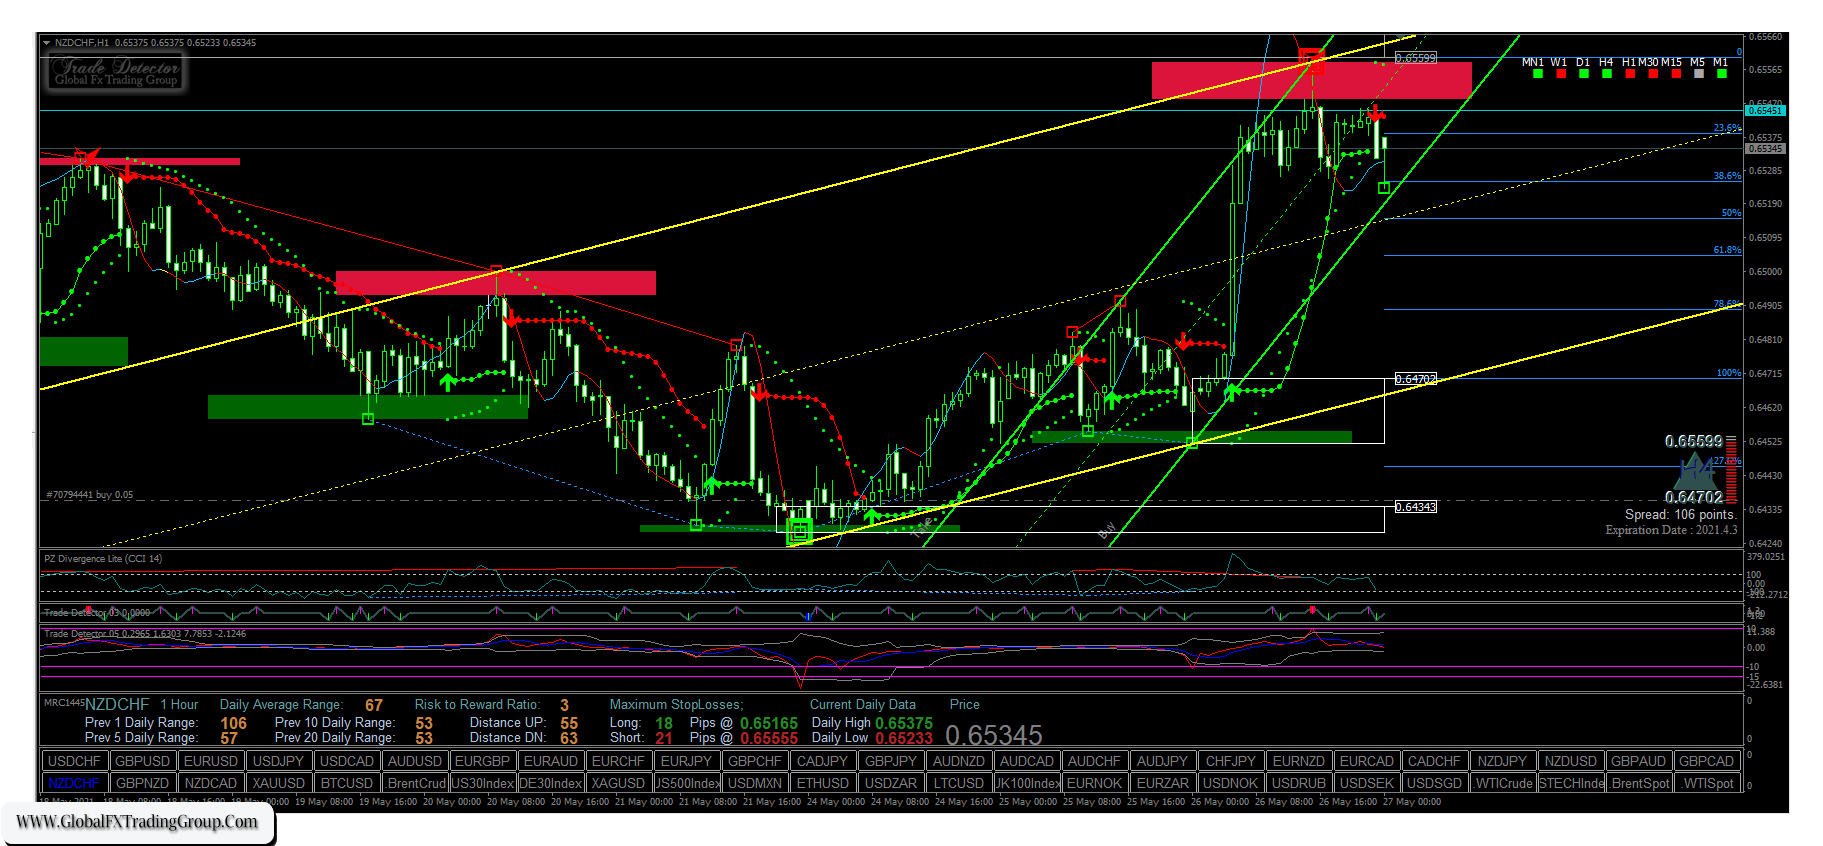
NZD/CHF 1 Hour Chart
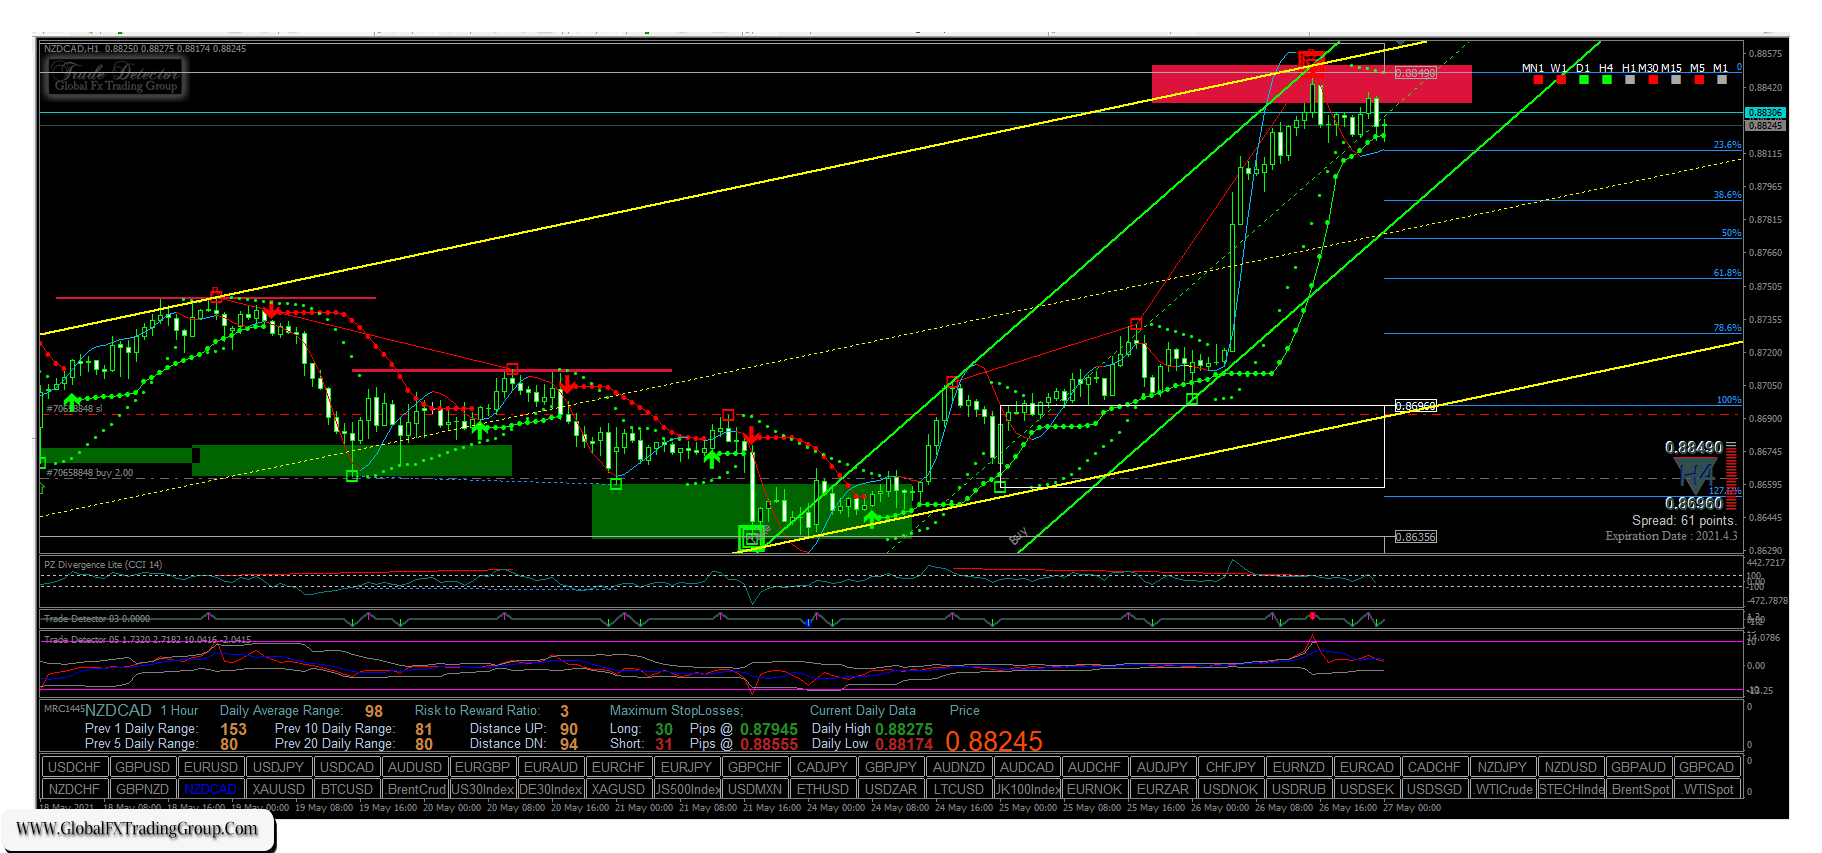
NZD/CAD 1 Hour Chart
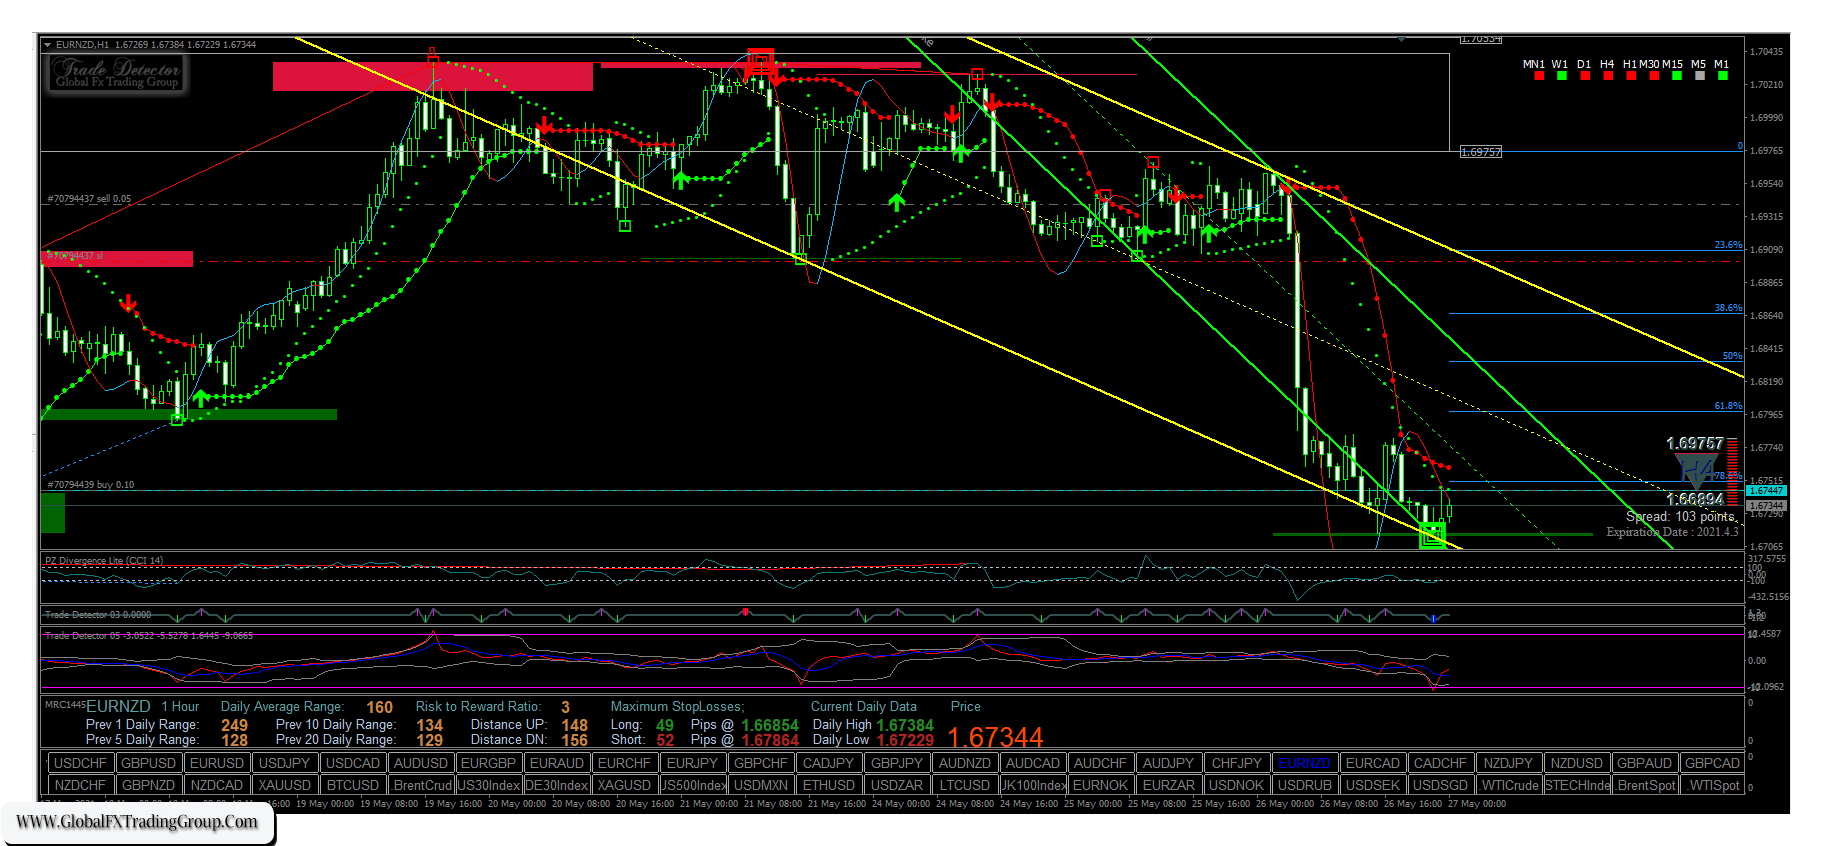
EUR/NZD 1 Hour Chart
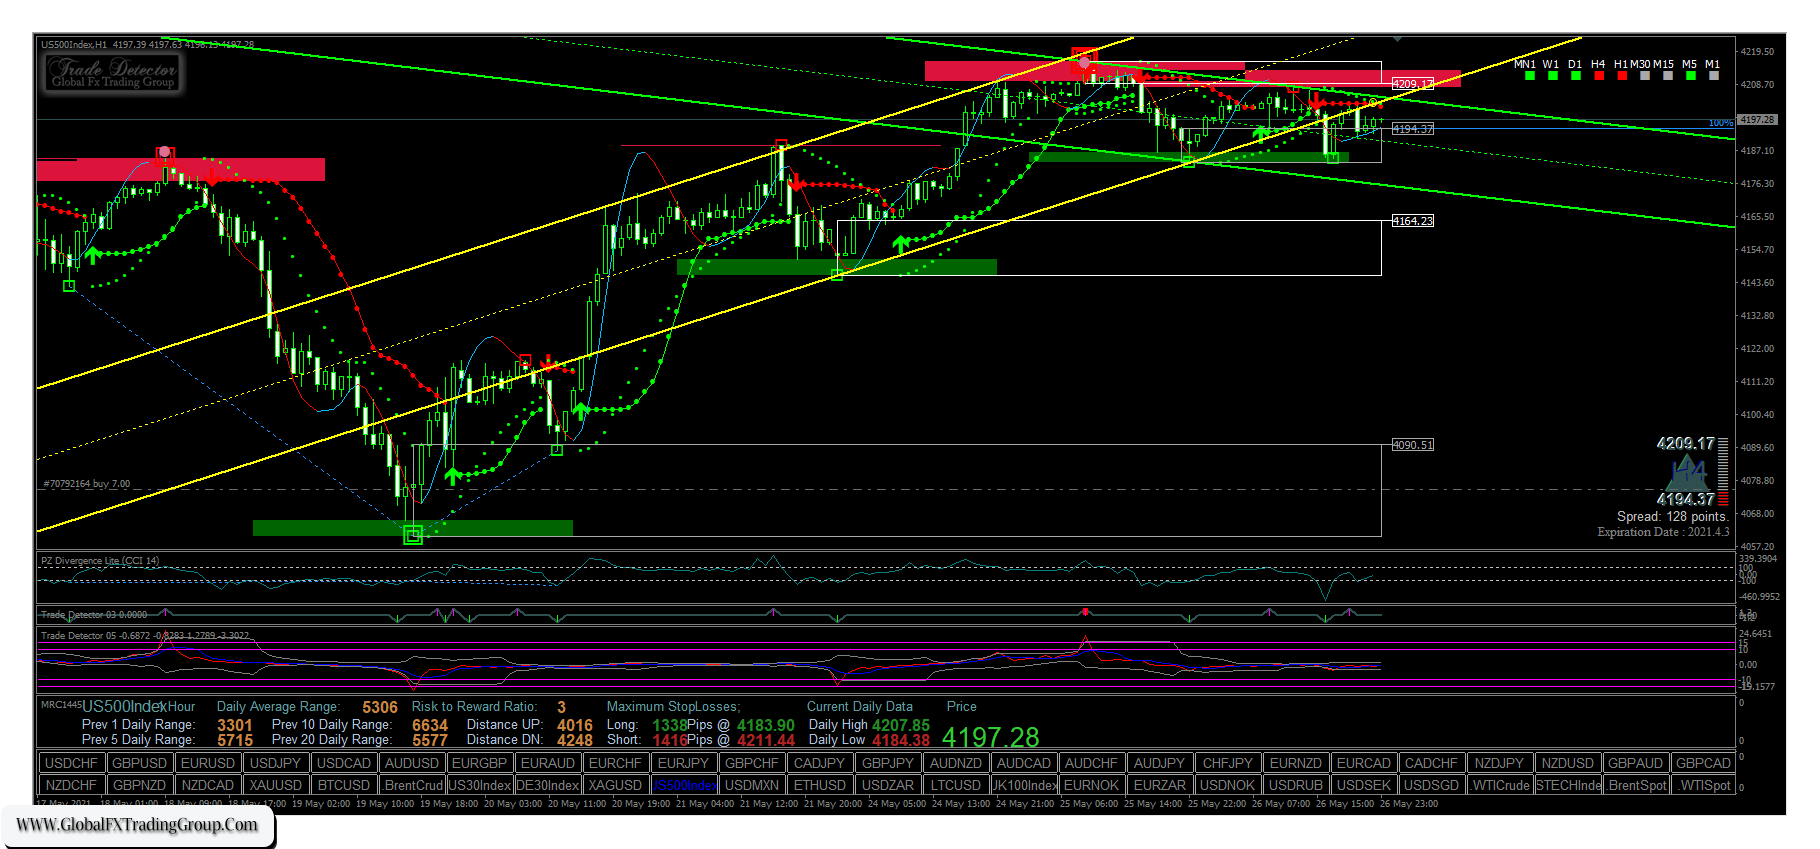
US500 Index 1 Hour Chart
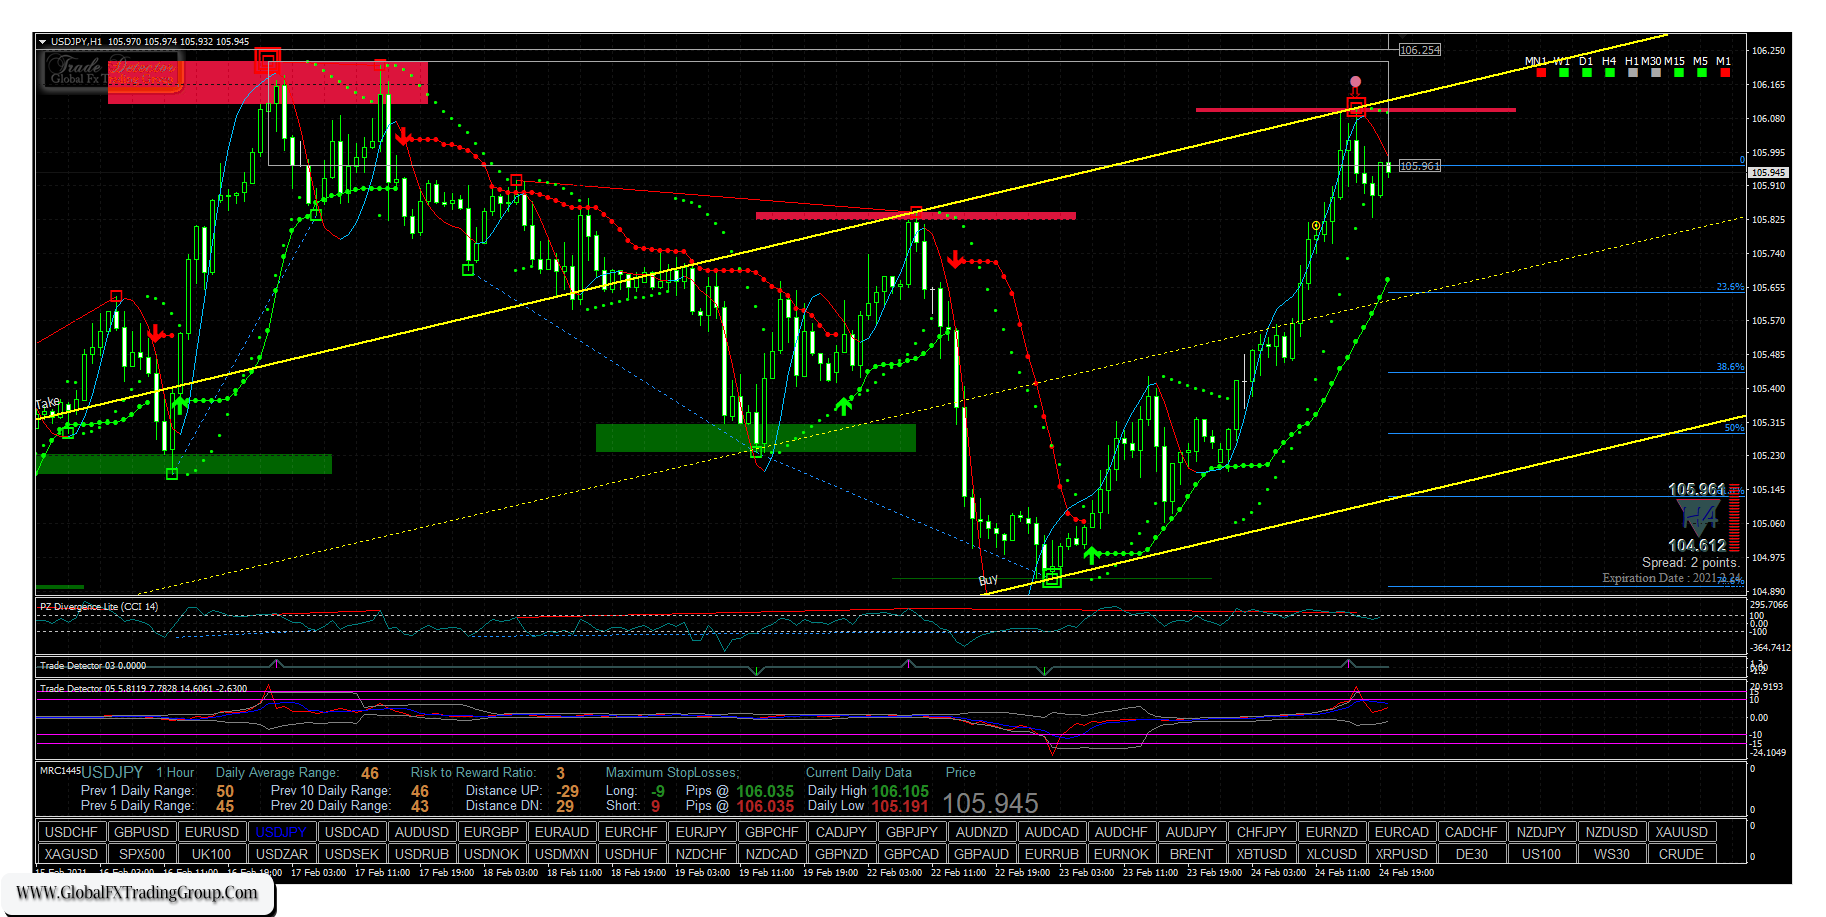
USD/JPY 1 Hour Chart
The above charts are a 1 hour charts, but all of the different time frames work the same. The large colored squares show extreme over bought and over sold conditions, indicating that a directional change is on the horizon. Then when the smaller yellow dots change direction, that is a further confirmation that the price reversal is underway.
Finally, when the green and red arrows appear, along with the larger red and green dots, its time to enter the trade. And then, there is no reason to get out of the trade until the process reverses. Simple. Easy. It has worked over time (see Jeff’s last 2000 trades on Ticker Tocker).
The software comes with 24/5 support and free membership in our Trade Detector Users Group where specific trades and strategies are discussed 24/7 under the guidance of our moderators, all accomplished traders in their own right.
David Leaver is our lead moderator, a seasoned pro with 27 years in the Fx business.. You can read more about David on his Linked In profile at: https://www.linkedin.com/in/dave-leaver-b419681b/
There are two pricing options for the Algo: 1. Pay $300/month or 2. Purchase it outright for $1900. Choose the option you prefer below.
You can order Trade Detector below, and be up and running today.
*The system is not just for Fx but works easily as well on Bitcoin, Stock Indices, Commodities (including gold and silver) and Bonds.
Contact Us

Contact us with your questions, comments, and suggestions. We would love to hear from you. We will try to respond in 48 hours, or as soon as possible.


