Yesterday’s U.S. inflation data exceeded even the most optimistic expectations: the Consumer price index fell from 3.3% YoY to 3.0% YoY against the expected 3.1% YoY, and the core CPI showed 3.3% YoY versus the forecasted 3.4% YoY. Traders now price in the probability of a September rate cut at 86.7%, and the yield on 5-year US government bonds fell from 4.23% to 4.14%.
The stock market (S&P 500) lost 0.88%, although, to be fair, the indexes closed mixed – Dow Jones +0.08%, Russell 2000 +3.77%, Nasdaq -1.92%. Currently, investor sentiment leans towards risk aversion, and while the euro has opted for a short-term alternative scenario with growth, it still has a high probability of reversing.

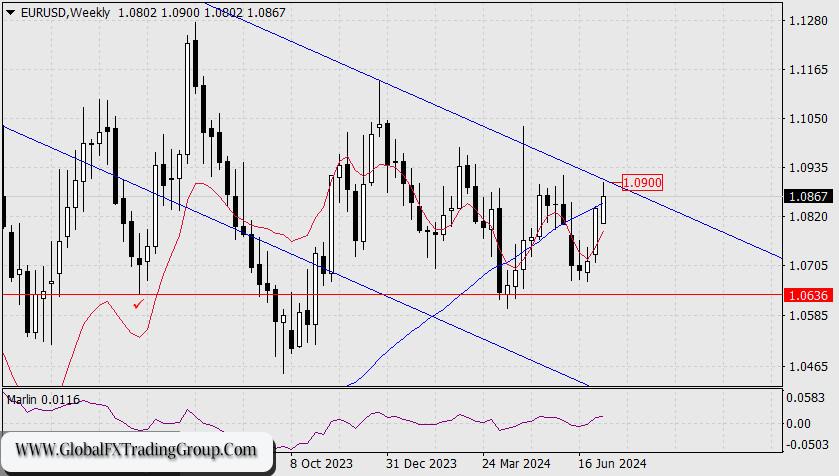
On the weekly chart, the price has approached the upper boundary of the descending price channel. If the price reaches this boundary on Monday, it will precisely hit the 1.0905 mark. If it’s today, it’ll be at the target level of 1.0905, as the channel gets lower each week. There’s about a 40% chance of a break above this channel, and if it does, the growth could be substantial, exceeding 1.11 (the benchmark from the peak on December 28, 2023).

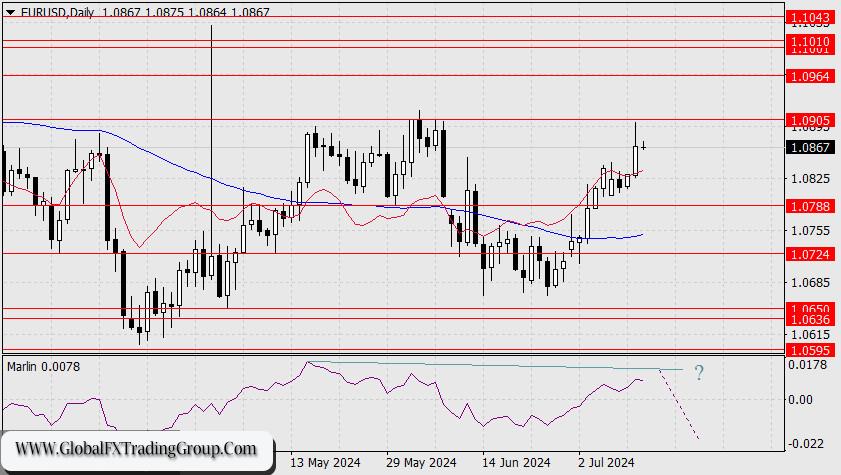
We expect that the reversal will occur earlier, from the level of 1.0964 (the peaks of March 13 and November 21, 2023), as Marlin is still capable of forming a divergence with the price on the daily chart. The best strategy in the current situation is to wait, as the price is not falling from current levels and has not consolidated above 1.0905. Yesterday’s trading volume was the highest in almost 3 months – the rise was definitely due to the closure of nearby Stop Loss orders, as many players were expecting the euro to fall. Until (and if) players shift towards expecting euro growth, the risk of a drop remains high.

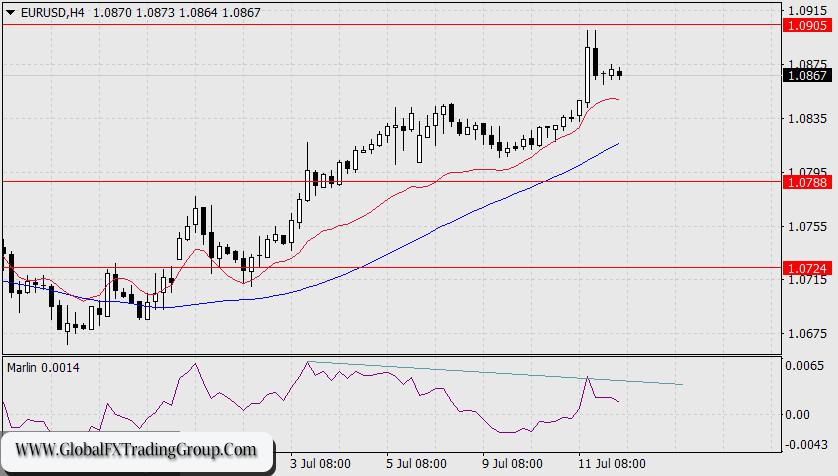
On the 4-hour chart, the price and the oscillator have formed a full divergence. This does not prevent the euro from reaching the level of 1.0905, so there is a small chance that the price will not climb above the nearest resistance level of 1.0905. On the weekly chart, this will appear as a false breakout of the MACD line. Of course, this is a very optimistic scenario for the bears, but until the price consolidates above 1.0905, assuming otherwise would be overly optimistic for the bulls.
*The market analysis posted here is meant to increase your awareness, but not to give instructions to make a trade.
If you have an interest in any area of Forex Trading, this is where you want to be.
Global Fx Trading Group is a world leader in providing Fx services, o individual traders, including: Unmatched funding programs, on-line education, virtual trading rooms, automation tools, robot building, and personal coaching.
The company was first established by Jeff Wecker, former member of the Chicago Board of Trade, with 28 years in the industry. Jeff has a keen understanding of the needs of Forex traders and those needs are our focus.
Please join our VIP Group while is still FREE …
https://t.me/joinchat/JqsXFBKpyj3YS4bLWzT_rg
Our mission is simple: To enhance as many lives as we can through education and empowerment.
#theforexarmy #forexsigns #forexsignals #forexfamily #forexgroup #forexhelp #forexcourse #forextrade #forexdaily #forexmoney #forexentourage #forextrading #forex #forexhelptrading #forexscalping #babypips #forexfactory #forexlife #forextrader #financialfreedom

